


After nearly running dry six months ago, Cape Town’s reservoirs have risen dramatically. Rain has poured down on southern Africa on several occasions in recent months. According to Cape Town’s Department of Water Affairs, water levels in the city’s main reservoirs stood at 55 percent of capacity on July 16, 2018.
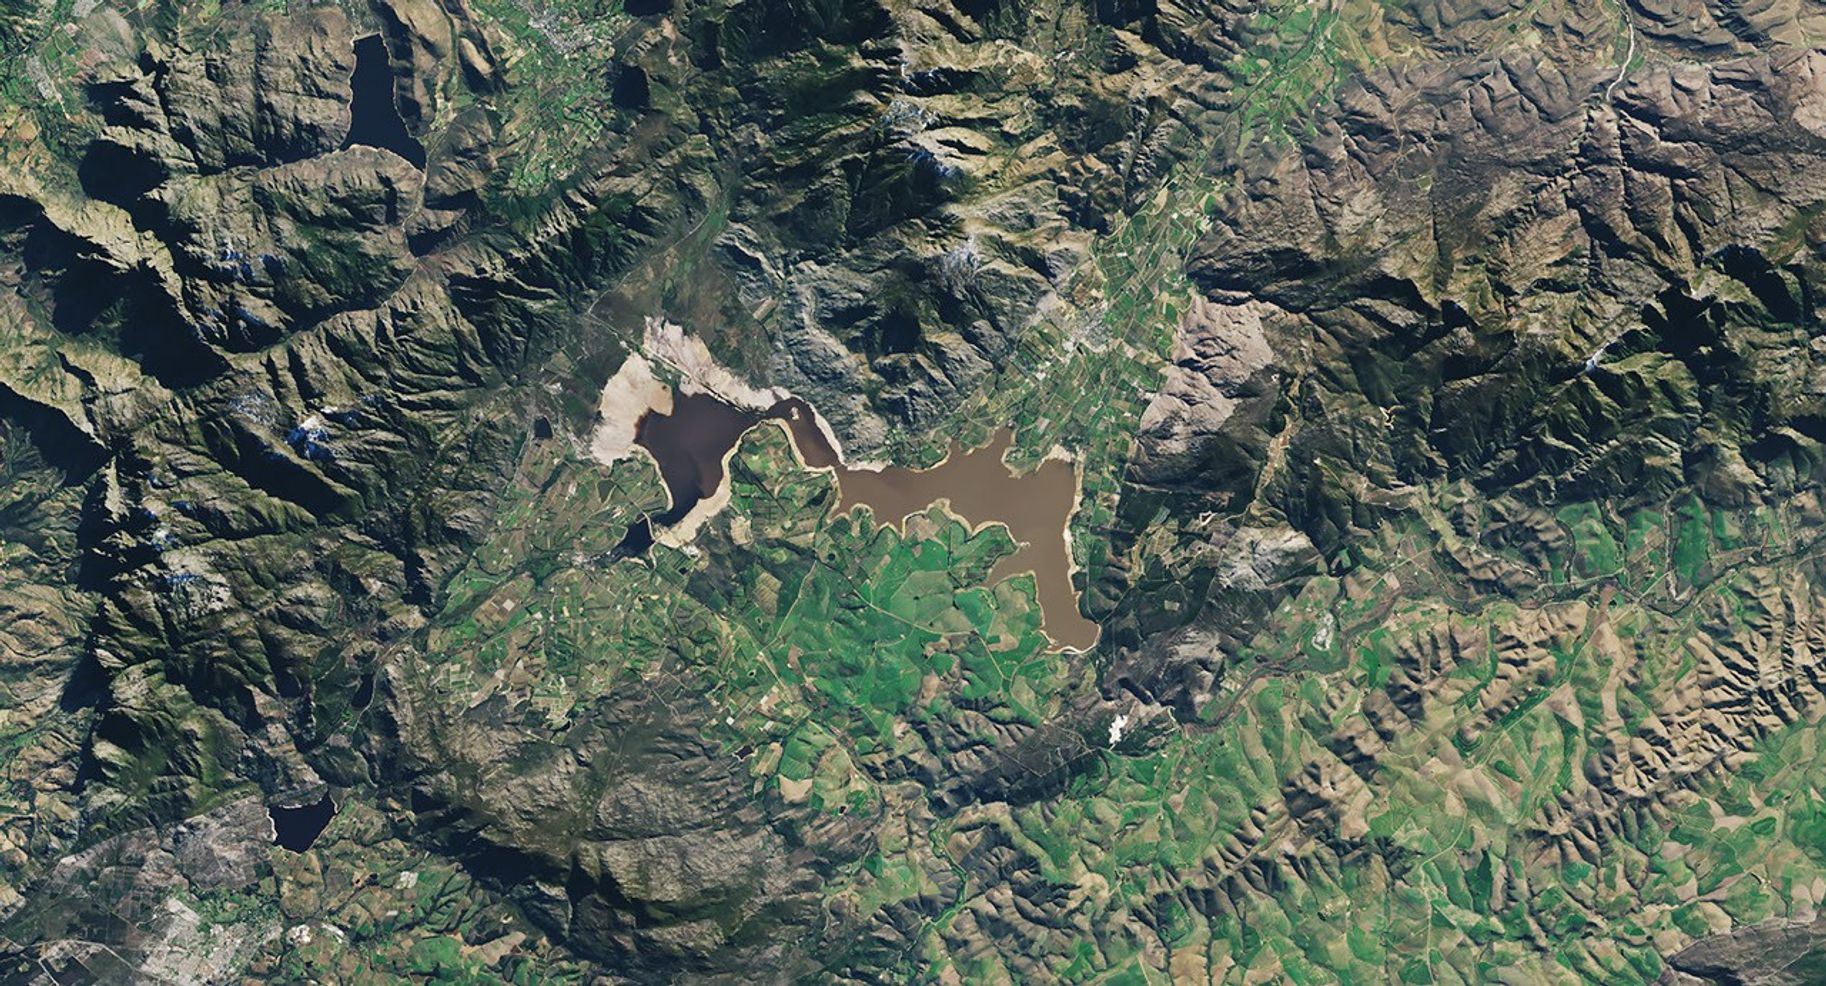
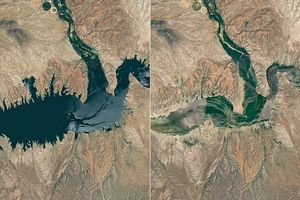
The largest reservoir—Theewaterskloof—holds 40 percent of Capetown’s total water storage capacity, so the state of that reservoir serves as a good barometer for the amount of water available to the city. The Operational Land Imager (OLI) on Landsat 8 acquires new imagery of the reservoir every two weeks. The animation above, based on Landsat imagery, shows the condition of the reservoir at two month intervals between 2015 and 2018. Parts of the reservoir with standing water appear dark blue; areas where the bottom of the reservoir was dry and exposed are light blue. The pair of natural-color images below, captured by OLI, show the change in water levels at Theewaterskloof between July 22, 2017, and July 9, 2018.
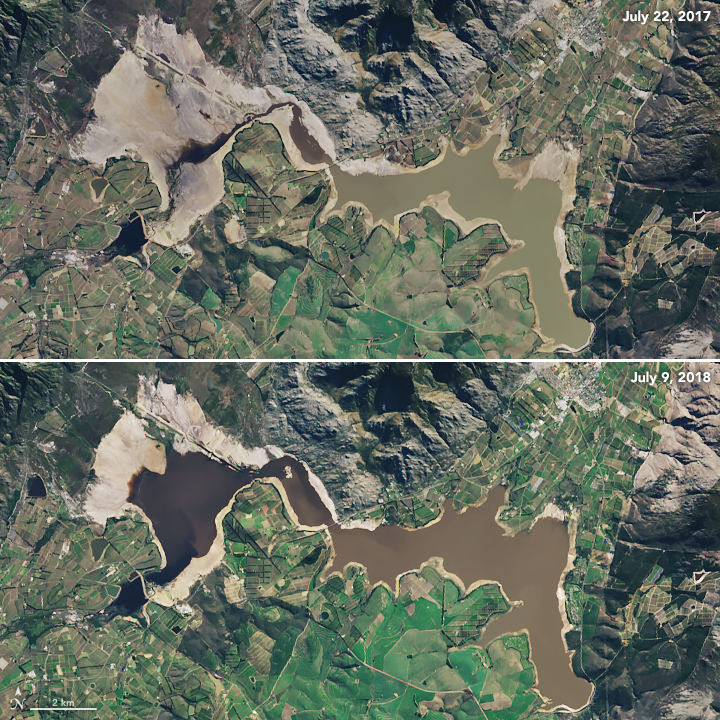
Water levels changed changed significantly between 2015 and 2018. While Theewaterskloof was 55 percent full in 2015, it dropped to 40 percent capacity in 2016 following a year of light rainfall. As the drought worsened, the reservoir shrank to 20 percent capacity by July 2017 and 13 percent by January 2018. With the arrival of heavier rains in April 2018, the reservoir bounced back to 40 percent capacity by July 16, 2018.
In June 2018, Cape Town authorities credited voluntary water conservation by residents, water use restrictions and tariffs, the installation of a city-wide pressure management system, a leak repair program, and the favorable rains for averting Day Zero, when most of the taps would have been shut off. Despite the recent increase in water stored in the reservoirs, the city plans to keep water-use restrictions in place until reservoirs are 85 percent full.
References & Resources
- City of Cape Town (2018, June 27) No Day Zero for 2019 if appropriate water restrictions are maintained. Accessed July 16, 2018.
- City of Cape Town (2018, July 16) Extended Dam Levels Report. Accessed July 16, 2018.
- City of Cape Town (2018, July 16) Dam Levels. Accessed July 16, 2018.
- City Lab (2018, July 11) How Cape Town Got to the Brink of Water Catastrophe. Accessed July 16, 2018.
- NASA Earth Observatory (2018, January 30) Cape Town’s Water is Running Out.
- news24 (2018, July 12) Western Cape edges closer to an end to the drought as dam levels continue to rise. Accessed July 16, 2018
- University of Cape Town (2018) Current season’s rainfall in Cape Town. Accessed July 16, 2018.
- University of Cape Town (2018, January 23) Five signs that Day Zero may be averted. Accessed January 29, 2018.
NASA Earth Observatory images by Joshua Stevens, using Landsat data from the U.S. Geological Survey . Story by Adam Voiland.