


![Request for Information – Potential [Placeholder for Prize]](https://assets.science.nasa.gov/dynamicimage/assets/science/psd/solar/2023/09/s/solarsystem_0.jpg?w=1024)


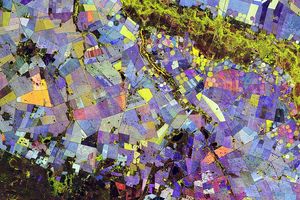
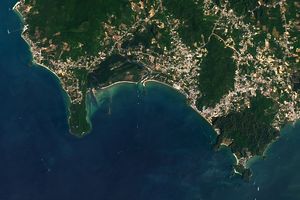
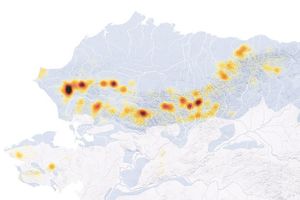
These Advanced Spaceborne Thermal Emission and Reflection Radiometer (ASTER)images cover an area of 8 x 4 km in Railroad Valley,NV, and were acquired August 17, 2001. The top image shows center-pivotirrigated fields, with healthy vegetation in red. The middle imagedisplays the Normalized Difference Vegetation Index (NDVI), a calculatedquantity that portrays the amount of vegetation. (To learn more about NDVI, read: Measuring Vegetation)The color code showshighest vegetation content in dark green, low vegetation cover in light green and pale yellow,and barren areas in light brown. The bottom image is athermal infrared channel, with warmer temperatures in white, and colderin black. In the thermal image, the northern-most and western-mostfields are markedly colder on their northwest areas, even though nodifferences are seen in the visible image or the NDVI image. This can beattributed to the presence of excess water, which can lead to cropdamage. The combination of information from different bands is apowerful tool to monitor crop health and maintenance procedures.
References & Resources
Image courtesy NASA/GSFC/MITI/ERSDAC/JAROS, and U.S./Japan ASTER Science Team
None