![Request for Information – Potential [Placeholder for Prize]](https://assets.science.nasa.gov/dynamicimage/assets/science/missions/a-step/FFR_Earth_Background_20251120%20.png?w=1024)


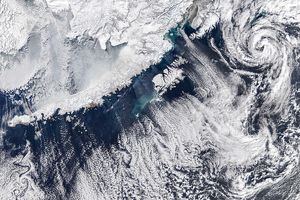
On March 17, 2016, the Moderate Resolution Imaging Spectroradiometer (MODIS) on NASA’s Aqua satellite acquired this natural-color image of cloud streets over the Norwegian Sea.
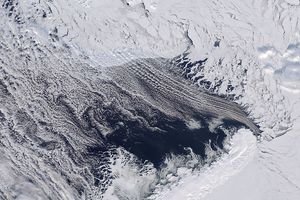
Cloud streets are long, parallel bands of cumulus clouds that form when cold air blows over warmer waters. On this day, an outbreak of cool air moved southward across Arctic sea ice toward northern Scandinavia. The difference in temperature between the sea surface and the air in this area can be well over 10 degrees Celsius (18 degrees Fahrenheit).
To transport the heat away from the sea surface, columns of heated air called thermals naturally rise through the atmosphere. The air masses rise until they hit a warmer air layer (temperature inversion), which acts like a lid. The rising thermals then roll over and loop back on themselves, creating parallel cylinders of rotating air. On the upper edge of these cylinders of rising air, clouds form. Along the downward side (descending air), skies are clear.
“The cloud streets are just the manifestation of nature trying to get rid of energy imbalances,” said Erik Kolstad, a weather and climate scientist at Uni Research and the Bjerknes Center for Climate Research in Bergen, Norway. “This is also what happens in tropical cyclones, which suck up heat from the warm ocean surface and transport it far away.”
The cold air outbreak in mid-March spurred the formation of more than just cloud streets; it also led to vortices southeast of Svalbard, over the Barents Sea. Kolstad notes that these “comma clouds” occur when warm, humid air starts to wrap counterclockwise around the cold air. When these air masses are lifted, clouds are formed. Comma clouds are the first sign that a small-scale low-pressure system (polar low) is forming. Given the right conditions—cool air aloft and the absence of a lid-like inversion—polar lows can grow into very fierce (though small-scale) cyclones.
“Cloud streets and polar lows are very common over the Norwegian Sea from October to April,“ Kolstad said. “March seems to be a month with a high frequency of this phenomenon.”
That corresponds to the time of year when there is ample Arctic sea ice to cool the air. The edge the sea ice pack in the Arctic Ocean is visible near the top of this image. Sea ice grows each year throughout the fall and winter and reaches its maximum extent sometime between February and April. On March 24, 2016, a week after this image was acquired, Arctic sea ice peaked at 14.52 million square kilometers (5.607 million square miles).
Overall, the 2015-2016 winter saw unusually few polar lows, and sea ice might have played a role. While there was more ice in March 2016 compared to other seasons throughout the year, the maximum extent was a record-low since the start of the satellite record in 1979.
“When there is little sea ice, there will be fewer cold air outbreaks,“ Kolstad said. “But this works both ways. Cold air outbreaks (northerly winds) are instrumental in transporting sea ice southwards, so a lack of cold air outbreaks also contributes to a lesser sea ice extent.”
References & Resources
- EarthSky (2016, January 18) What are cloud streets? Accessed March 25, 2016.
- Norwegian Meteorological Institute (2016, March 17) Longyearbyed (Svalbard) Accessed March 30, 2016.
- NASA’s Goddard Space Flight Center (2016, March 17) 2016 Arctic Sea Ice Wintertime Extent Hits Another Record Low. Accessed March 30, 2016.
- WordPress blog, Erik Kolstad (2016) Polar Lows. Accessed March 30, 2016.
NASA image by Jeff Schmaltz, LANCE/EOSDIS Rapid Response . Caption by Kathryn Hansen.