


Rare snowstorms in Rome and Tripoli and mounting death tolls from exposure were among the consequences of a severe cold snap in Europe in late January and early February 2012. Meteorologist Jeff Masters described it as Europe’s worst stretch of cold weather since February 1991.
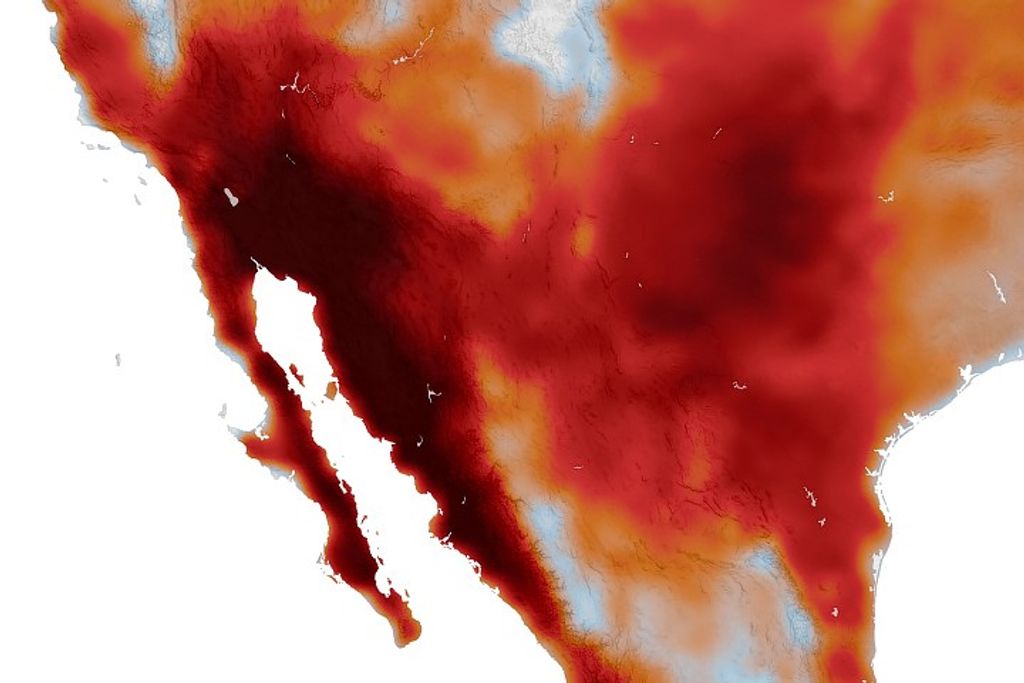
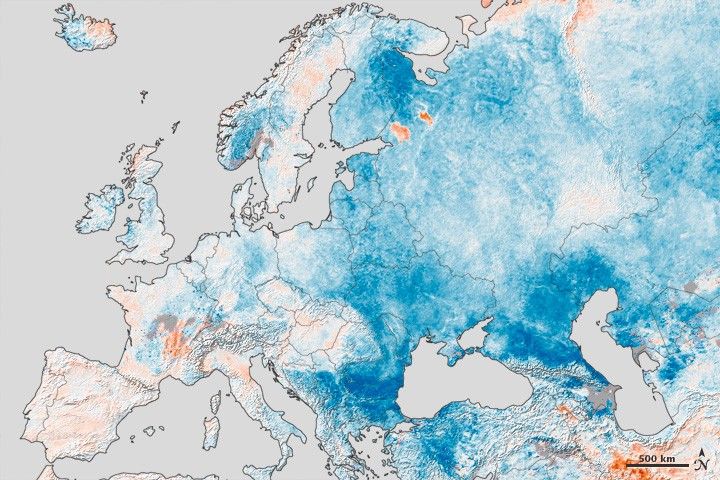
This map above shows temperature anomalies for Europe and western Russia from January 25 to February 1, 2012, compared to temperatures for the same dates from 2001 to 2011. The anomalies are based on land surface temperatures observed by the Moderate Resolution Imaging Spectroradiometer (MODIS) on NASA’s Terra satellite. Areas with above-average temperatures appear in red and orange, and areas with below-average temperatures appear in shades of blue. Oceans and lakes appear in gray.
Blue dominates this image, with most regions experiencing temperatures well below normal. Some of the most severe temperature anomalies occur in northwestern Russia and around the Black Sea.
Masters explains that the unusual cold is a product of the jet stream. Jet streams are bands of strong, upper-atmospheric winds that blow from west to east around the globe. These bands roughly separate colder air at higher latitudes from warmer air at middle to low latitudes, and they generally blow straight west to east. “But this winter, the jet has had a highly convoluted shape, with unusually large excursions to the north and south,” Masters states. “When the jet bulges southwards, it allows cold air to spill in behind it, and that is what has happened to Europe over the past two weeks.” When the jet stream adheres to a convoluted pattern for long enough, extreme weather can result.
The Arctic Oscillation (AO) Index provides an indication of whether the jet stream has formed an unusual bulge. When the AO is strongly negative, jet stream winds are comparatively weak, meaning it has drooped southward over Europe, dragging frigid air with it. A negative AO also often means unusual cold and snow over North America, but due to other factors, much of the United States has experienced below average snowfall.
References & Resources
- Dr. Jeff Masters’ WunderBlog, via Weather Underground. (2012, February 3). Europe cold wave deaths hit 200; low-snow winter for the U.S. Accessed February 9, 2012.
- Dr. Jeff Masters’ WunderBlog, via Weather Underground. (2012, February 7). Harsh winter weather continues in Europe; rare snowstorm hits Libya. Accessed February 9, 2012.
- National Weather Service. (2005, December 12). Arctic Oscillation (AO). National Oceanic and Atmospheric Administration. Accessed February 9, 2012.
- National Weather Service. (2011, October 21). Jet Stream. National Oceanic and Atmospheric Administration. Accessed February 9, 2012.
- Simeonova, D. (Agence France-Presse). (2012, February 7). Floods add to Europe’s cold to claim more lives. Google News. Accessed February 9, 2012.
NASA Earth Observatory image created by Jesse Allen, using data provided courtesy of the Land Processes Data Active Archive Center (LPDAAC). Caption by Michon Scott.
None