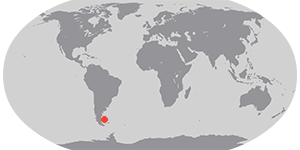
Located over the continental shelf of southeastern South America is one of the world’s most productive and complex marine ecosystems. Covering about 1.2 million square kilometers (4.6 million square miles) of coastal waters, the Patagonia Large Marine Ecosystem stretches from the Rio de le Plata (a wide estuary at the mouth of the Paraná River) to the southern tip of the continent.
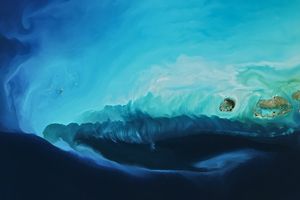
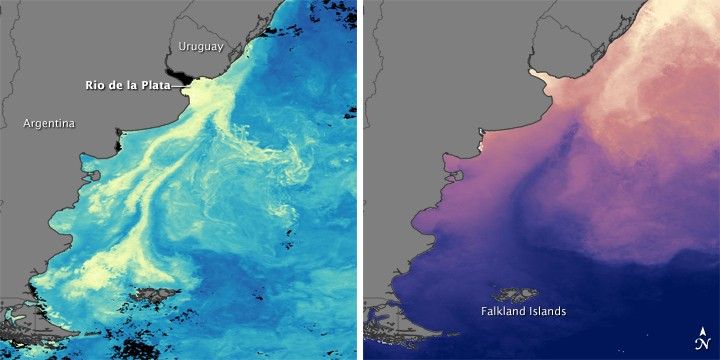
In November 2009, as summer approached in the Southern Hemisphere, the foundation of the ecosystem’s food web—plant-like microorganisms called phytoplankton—bloomed expansively, brightening the waters with living ribbons of color. The image on the left shows the monthly average chlorophyll concentration in milligrams per cubic meter of water. High chlorophyll concentrations (yellow) mean large populations of phytoplankton, which use chlorophyll and other pigments to capture sunlight for photosynthesis.
The sea surface temperature image (right) reveals one of the reasons for the region’s productivity: the convergence of two wind-driven ocean currents. The warm, salty Brazil Current meanders south over the continental shelf, where it meets the cold, less-salty Falklands/Malvinas Current, a north-flowing branch off the Antarctic Circumpolar Current.
In the spring and summer, the convergence zone occurs at about the latitude of the Rio de la Plata, which is where it seems to be based on the water temperatures shown in the sea surface temperature image. Blues and purples (cooler water) dominate the image south of the estuary, while pinks and yellows (warmer water) dominate the image north of there.
The convergence of two water masses of different temperatures and saltiness enhances mixing of the water, both vertically and horizontally. Vertical mixing brings nutrient-rich water up from deeper in the ocean, restocking surface waters.
These images are made from data collected by the Moderate Resolution Imaging Spectroradiometer (MODIS) on NASA’s Aqua satellite in November 2009. Aqua has been collecting data on the ecological and physical state of the ocean since its launch in 2002. Monthly maps of chlorophyll and sea surface temperature from Aqua are available in Global Maps on the Earth Observatory.
References & Resources
NASA Earth Observatory images created by Jesse Allen, using data provided courtesy of the Ocean Color Group team at NASA’s Goddard Space Flight Center. Caption by Rebecca Lindsey.
None