


When Alfredo Huete saw Scott Saleska’s poster presentation at a meeting of the American Geophysical Union in 2002, he felt like he had been vindicated. Several years before, Huete had been sponsored by NASA to develop techniques for mapping global vegetation using data from a new sensor planned for two of the space agency’s upcoming Earth-observing satellite missions. For several years after Terra, the first satellite, launched in 1999, the University of Arizona remote-sensing ecologist had been worrying over the data processing and mapping technique he and his team had proposed.

For nearly two decades, scientists had been mapping global vegetation patterns using a vegetation scale, or index, based on data from a series of satellite sensors operated by the National Oceanic and Atmospheric Administration. The NASA sensors built on and even surpassed the capabilities of the previous sensors, but still, Huete had to deal with a new kind of satellite sensor, a new method for producing the vegetation maps—and the awareness that he was making a product that would go out into a global research community with NASA’s name on it. “I felt a lot of pressure,” Huete says.

As they were developing and testing their technique, Huete and his team frequently checked that the maps matched real-world seasonal changes in vegetation in different ecosystems, from African savannas to eastern North American forests. Although their maps captured the expected seasonal changes in most areas, one area bothered Huete: the Amazon. As data from Terra began accumulating, he noticed something peculiar: the Amazon rainforest looked greener to the satellite in the forest’s dry season than it did during the rainy season. Huete knew that parts of the forest go several months with little or no rain. How could the forest be thriving during those times of seasonal drought?

Before the 2002 conference Huete had spent several years repeatedly tinkering with the data and the mapping technique. “When you see something you are not expecting, you have to ask yourself, ‘What are all the possibilities for a remote-sensing product going wrong?’” Among the possibilities are things in the atmosphere that keep the satellite from having a clear view of the surface. “We checked for aerosols [particles in the air, such as smoke from biomass burning] and clouds, which can potentially reduce the vegetation signal obtained by satellites. Someone suggested that maybe there was flooding on the forest floor during the wet season, so we looked at that. We looked how the vegetation maps changed if the light [hitting a particular patch of vegetation] was direct or diffuse. We just kept re-doing and re-doing the data products,” he says. Each time they made a change, they wondered if the dry-season green-up would disappear. But with each refinement, it stayed. His confidence grew, but Huete still wasn’t sure. Was this for real? Or was it just a sign he was still doing something wrong?

Abandoning His Doubts
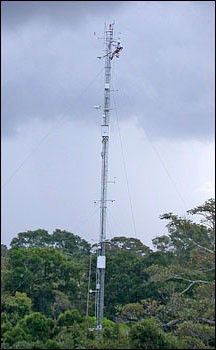
In late 2002, Huete got just the sign he needed to put his doubts behind him. At a meeting of the American Geophysical Union, he saw a poster by ecologist Scott Saleska, then part of a research group led by Steven Wofsy of Harvard University, showing results of field studies at a location in the Tapajos National Forest in Brazil. The site was home to a research tower holding scientific instruments that Saleska and his colleagues had designed and operated as part of NASA’s contribution to a Brazilian-led international research project called “LBA,” short for the “Large-Scale Biosphere-Atmosphere Experiment in Amazonia.”
Among the most important measurements collected on the 60-meter tower was the uptake and release of carbon dioxide by the forest. Vegetation takes in carbon during photosynthesis, but also releases it during respiration. Decomposition of dead trees and vegetation also releases carbon dioxide back into the atmosphere. Over the course of the project, they collected observations of the flux of carbon dioxide from the forest and compared those observations with the growth and death of trees surrounding the tower. The observations would reveal whether, overall, the area was a sink or a source of carbon.
After they had about two years of data, Saleska realized they were seeing something surprising. Although ecosystem models suggested that plants should be taking up less carbon dioxide in the dry season, when trees were expected to be water-stressed, what they saw was the opposite. Photosynthesis was greater during the dry season than during the wet season. “When I first plotted the comparison between our data and the models,” said Saleska, “I thought for a minute that I had made a mistake by plotting the model predictions upside down.”
But results from a second flux tower nearby, operated by Saleska’s colleagues, Michael Goulden from the University of California-Irvine, and Humberto da Rocha, from Brazil’s University of Sao Paulo, showed exactly the same “backwards” pattern, boosting Saleska’s confidence that the measured pattern at both towers was right. Saleska and his colleagues combined the results from the towers and presented them on a poster for the meeting.
“For several years, we had been seeing this dry-season green up [in the satellite data] and wondering whether it was real or not,” says Huete. “But when I saw Scott’s results, that the ground data at the tower sites showed the same thing as the satellite data, it really changed everything for me. From that moment, I realized we could stop focusing on ‘what’s wrong’ and instead focus on how to demonstrate that what we were seeing was real.”
Getting Further Encouragement
As he began pulling the satellite data together and deciding the best way to demonstrate to other scientists that the dry-season green-up wasn’t a mistake, Huete got some further encouragement that he was on the right track. In 2003, ecologist Rama Nemani of NASA Ames Research Center (a long-time colleague of Huete’s) and other researchers published research that linked global changes in vegetation productivity between 1982 and 1999 to the three environmental conditions that most affect plant growth: precipitation, sunlight, and temperature. Using 20 years of climate data combined with satellite-based vegetation maps, the team developed a model that predicted which of the three factors most influenced the vegetation in different places on Earth.
Among the most interesting findings, says Nemani, was that the Amazon had experienced a large increase in productivity, apparently because of decreased cloud cover and increased sunlight. “Our analysis indicated that growth in the Amazon was light-limited, rather than water-limited,” explains Nemani. Over the long-term, the Amazon had become more productive in response to greater sunlight. Huete and Nemani thought that the same phenomenon could be operating on the seasonal scale.
Detecting the Amazon's Seasonal Signal
Trying to describe the big picture of seasonal dynamics across the entire Amazon Basin puts scientists in a catch-22. The forest is so big that satellites are the only way to make observations of the entire forest. But measurements collected from hundreds of kilometers above can sometimes be hard to tie to specific biological processes on the ground. On the other hand, a handful of ground stations scattered throughout 7.5 million square kilometers of forest can’t tell the forest’s entire story, either. To make a convincing case for an Amazon-wide, dry-season green-up, Huete knew that he would need both perspectives: space-based and ground-based.
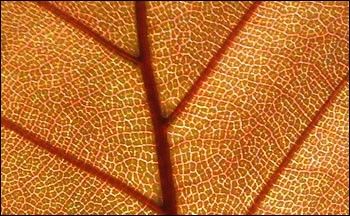
For the satellite-view, Huete and his research team compiled 5 years of satellite vegetation data from the Moderate Resolution Imaging Spectroradiometer sensor on NASA’s Terra satellite. The maps are based on the relative amounts of red and near-infrared light that the sensor detects over a location on Earth. Chlorophyll in vegetation absorbs red light, while “scaffolding” (like cell walls) in the plants’ leaves reflect near-infrared. An area that reflects very little red light but a lot of near-infrared light back to space is likely covered in vegetation; scientists call this signal “greenness.” Greenness is an optical (light-based) way to measure forest productivity.
Like most tropical locations, the Amazon is very cloudy, especially in the rainy season. In the dry season, it can be pretty smoky from slash and burn deforestation and agricultural fires. The high humidity (water vapor) in the atmosphere can also interfere with measurements from satellites. To make sure their vegetation maps were free of clouds and other data contamination, Huete and his colleagues selected only the best-quality data from 2000-2005 and averaged them into a single “typical” Amazon year.
Once they had their example year, the team pored over the maps, looking at seasonal changes in greenness at three different scales: the whole Amazon, regional slices called transects, and small areas surrounding research towers like the one where Saleska worked. They subtracted wet season and dry season greenness values to identify seasonal patterns. At tower locations in undisturbed forests and sites that had been converted to pasture, Huete and Saleska made meticulous week-by-week comparisons of satellite greenness and ground-based measurements of carbon dioxide uptake.
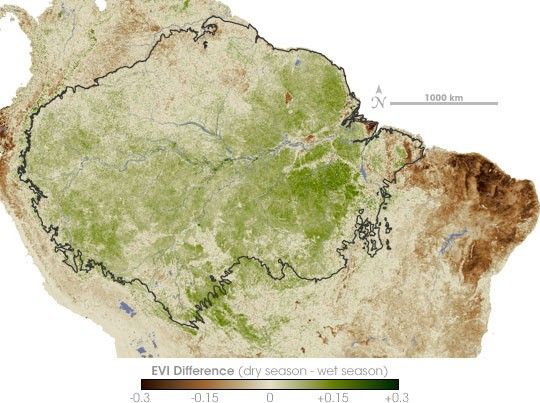
At each scale, they saw the same pattern: undisturbed rainforests became “greener” and increased their photosynthesis throughout the dry season. In the regional transects, the scientists discovered that the longer the area’s dry season was, the greater the greening effect was. Even though it might seem like months with little or no rain ought to slow down the forests’ ability to photosynthesize, Huete says the reverse appears true. “The dry season, with less clouds and higher sunlight, is actually the ‘good’ season.”
Forecasting the Future of the Amazon
As counterintuitive as a “good” dry season might seem, that response is perfectly in tune with research about the soil-water-tapping potential of mature rainforest trees. Since the early 1990s, field studies and soil-moisture modeling research have been accumulating evidence that in the undisturbed rainforest, roots extend as far as 20 meters (more than 60 feet) into the soil, where the wet-season rains are stored. Rather than being a time of stress, the normal dry season may be the forests’ most productive time of year because the rain clouds clear up, and more sunlight reaches the forest.
But the dry-season green-up only happens in undisturbed forests, stresses Huete. At locations where the forest has been converted to pasture or farmland, the dry season has the more intuitive effect: the vegetation “browns down” in response to decreased soil moisture. Once the deep roots of the mature trees are lost, the access to the water stored deep in the soil is lost as well.
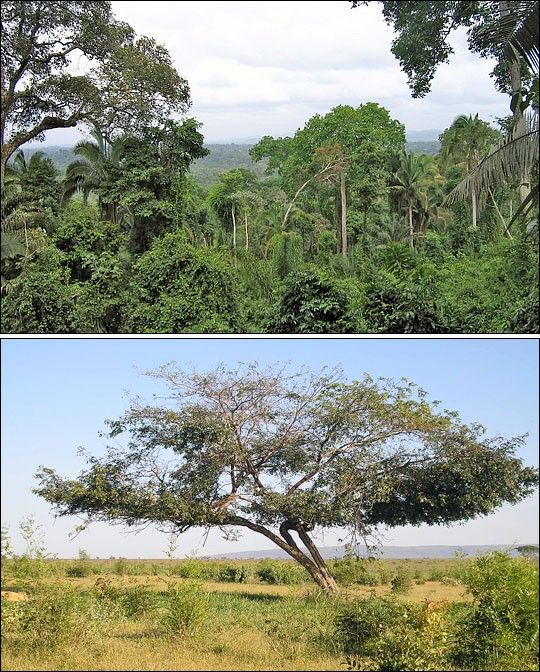
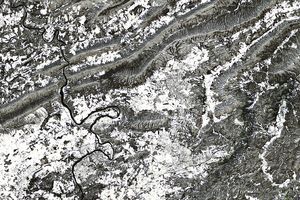
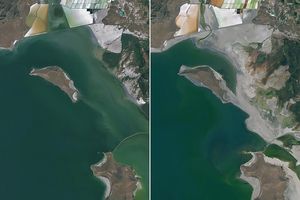
Because of the Amazon’s size and productivity, small changes in the carbon stored there can produce a global effect. Many ecological models are based on the idea that the dry season is a time of stress. Some models predict that future warming and drying of Earth’s climate may cause the rainforest ecosystem to collapse, turning the area from lush forest (top) into tropical savanna (below). Such a transformation would dramatically change the Amazon’s role in the global carbon cycle. The discovery of a dry-season green-up indicates that many questions remain about how the Amazon will respond to climate change. (Rainforest photograph copyright Brant Olson, pasture photograph copyright Lady Drid.)
“Some current ecological models of the Amazon actually have the Amazon getting browner during the dry season,” explains Huete. If the seasonal cycle of green-up and photosynthesis in a model is wrong, the ability to predict uptake and release of carbon dioxide, water availability, and fire risk would probably be off as well.
Among the key implications, explains Saleska, is the fate of the Amazon itself. In most models that link simulations of global climate to vegetation dynamics, the Amazon has a big influence on carbon because even small changes in the great stores of carbon in the vast Amazon forests can have significant impacts at the global scale. “But what we are learning is that Amazon is highly sensitive to hydrological change,” he says. “When the modelers couple their climate models to ecosystem models of the Amazon and run them out over the next century, some models predict that Earth’s warming climate will cause the whole Amazon ecosystem to collapse, to become a savanna.”
Instead of a dense forest richly layered with trees, shrubs, plants, and vines, the whole area could instead be covered by grass and scattered trees. In addition to the radical transformation of the ecosystem and loss of biodiversity, “there would be significant global impacts of that collapse,” explains Saleska. After taking into account the current rates of deforestation, scientists think the Amazon region may be neutral with respect to carbon losses and gains. But if savanna replaced the rainforest, says Saleska, “the whole area would switch from being close to neutral on average to being a big source of carbon.”
“But if these models are getting the seasonality wrong, then the impacts [of climate change] may not be what we expect,” he continues. Predictions of ecosystem collapse are based on the idea that the dry season is a time of stress and declining greenness. If that isn’t true, then perhaps the Amazon will be more resilient than the models predict. On the other hand, a typical dry season isn’t the same as a lengthy El Niño-induced drought. Previous studies, including a drought-simulation experiment conducted during LBA, indicate that the more severe, extended declines in rainfall that can happen during strong El Niño events do produce stress in the forest, especially fragmented or damaged areas. With forest disturbance on the rise and predictions by some climate models that El Niño events may increase as climate warms, the fate of the Amazon is unclear.
In the near future, Saleska and Huete will be working together to do a synthesis of all the available LBA tower observations with the satellite data to come up with a basin-wide estimate for the flux of carbon in the Amazon. In the meantime, says Saleska, everyone is keeping their eyes out for the next strong El Nino because observations collected during the event could provide the next key piece of the puzzle of how the Amazon responds to large-scale climate variation and change. Knowing the Amazon’s baseline seasonal response should help scientists judge when and how future climate events may disturb the balance of such an important and sensitive ecosystem.
References
- Huete, A.R., Didan, K., Shimabukuro, Y.E., Ratana, P., Saleska, S. R., Hutyra, L.R., Yang, W., Nemani, R.R., and Myneni, R.(2006) Amazon rainforests green-up with sunlight in dry season. Geophysical Research Letters, 33, L06405, doi:10.1029/2005GL025583.
- Saleska, S.R., Miller, S.D., Matross, D.M., Goulden, M.L. Wofsy, S.C., da Rocha, H.R., de Camargo, P.B. Crill, P., Daube, B.C., de Freitas, H.C., Hutyra, L., Keller, M., Kirchhoff, V., Menton, M. Munger, J.W., Hammond Pyle, E. Rice, A.H., Silva, H. (2003) Carbon in Amazon Forests: Unexpected Seasonal Fluxes and Disturbance-Induced Losses. Science 302, 1554–1557.
Links
- Introduction to the Large-scale Bisophere-Atmosphere Experiment in Amazonia
- LBA-ECO Project Website.
- Alfredo Huete’s Webpage. Department of Soil, Water, and Environmental Science at the University of Arizona.
NASA Earth Observatory story by Rebecca Lindsey. Design by Robert Simmon.