



















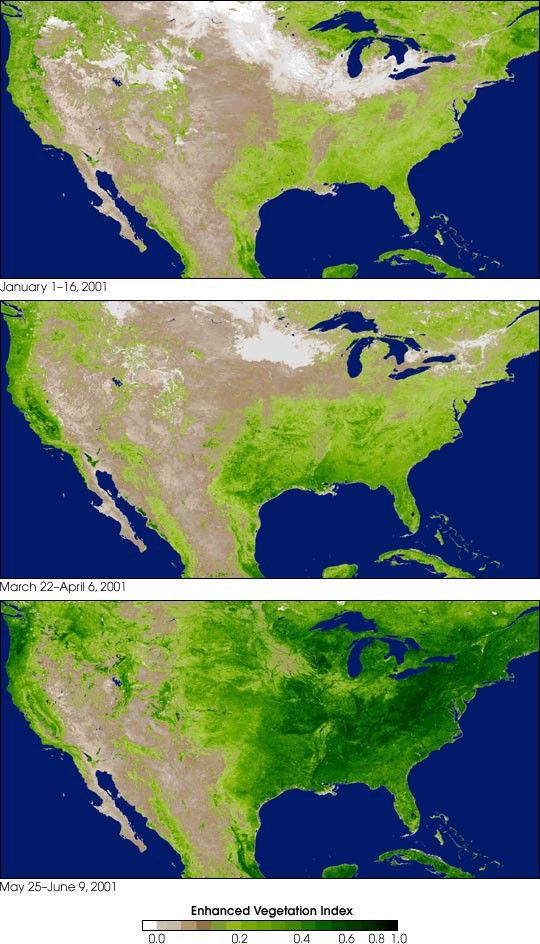
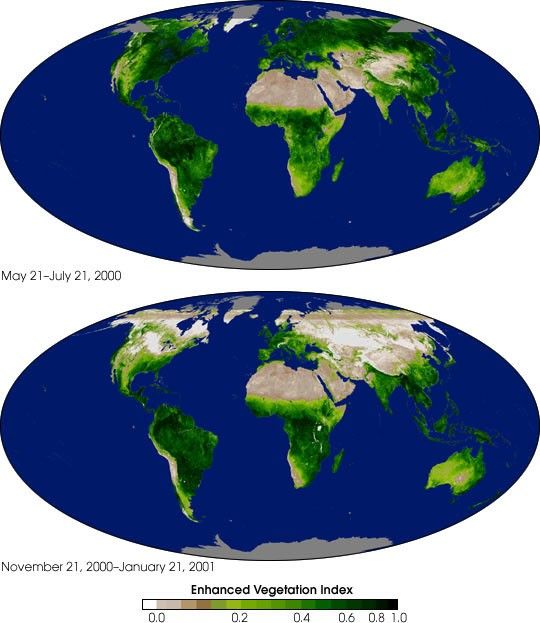
The Moderate-resolution Imaging Spectroradiometer (MODIS) Enhanced Vegetation Index (EVI)provides a look at vegetation around the globe year round. These seasonal images were made from averaging two months of MODIS EVI observations centered on the first day of each season: a month before and after June 21, 2000, and December 21, 2000. As the seasons change, the mirroreffect of seasonality is seen, with vegetation alternatively blooming and fading in each hemisphere. For instance, the Northern Hemisphere’s vegetation is high while the Southern Hemisphere’s is low. The index values in this false-color image range from 0, indicating no vegetation, to nearly 1,indicating densest vegetation. Gray areas indicate places whereobservations were not collected.
For high-resolution images and animations, visit “MODIS Instrument Improves Global Vegetation Mapping.”
For detailed information about the EVI data product, visit http://gaea.fcr.arizona.edu/projects/modis/.
References & Resources
Images courtesy NASA/GSFC/University of Arizona
None