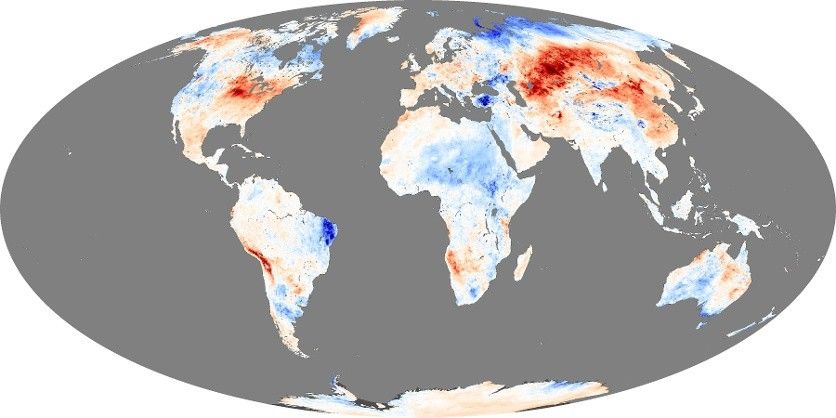
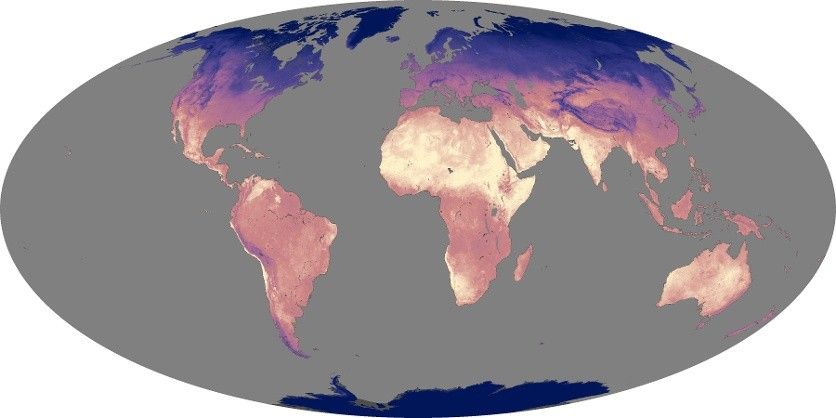
Sea surface temperature is the temperature of the top millimeter of the ocean's surface. An anomaly is a departure from average conditions. These maps compare temperatures in a given month to the long-term average temperature of that month from 1985 through 1997. Blue shows temperatures that were cooler than average, white shows near-average temperatures, and red shows where temperatures were warmer than average. The maps are made from data collected by the Advanced Microwave Scanning Radiometer-EOS (AMSR-E) compared to historical data collected by a series of National Oceanic and Atmospheric Administration (NOAA) satellites.
Some sea surface temperature anomalies are simply transient events, not part of a specific pattern or trend. Other anomalies are more meaningful. At irregular intervals (roughly every 3-6 years), the sea surface temperatures in the Pacific Ocean along the equator become warmer or cooler than normal. These anomalies are the hallmark of El Niño and La Niña climate cycles, which can influence weather patterns across the globe. This time series shows the building and subsiding of a La Niña event from early 2007 through mid-2008.
Strong, localized sea surface temperature anomalies may reveal that an ocean current, such as the Gulf Stream Current off the east coast of the United States, has veered off its usual path for a time or is stronger or weaker than usual. Sea surface temperature anomalies that persist over many years can be signals of regional or global climate change, such as global warming. For example, the Arctic Ocean is shaded red throughout the entire time series of the animation. The warm anomaly appears to intensify in the Northern Hemisphere summer. This pattern results from the fact that sea ice is retreating to a smaller area in the summer now than in the past; areas that used to be covered with ice all summer are now open water.
Sea surface temperature anomalies have practical as well as scientific applications. For example, in coastal areas, anomalous temperatures (either warm or cool) can favor one organism in an ecosystem over another, causing populations of one kind of bacteria, algae, or fish to thrive or decline. Warm sea surface temperature anomalies can also warn natural resource managers where coral reefs may be in danger of bleaching.
View and download more of these data from NASA Earth Observations (NEO):
Sea Surface Temperature Anomaly