


Global surface temperatures in 1999 fell back from the record setting high level of 1998, which was the warmest year in the period of instrumental data, report researchers at the NASA Goddard Institute for Space Studies who analyze data collected from several thousand meteorological stations around the world. But 1999 was still one of the warmest years of the century, as shown in Figure 1.

Although global temperature fluctuates considerably from year to year due to chaotic variability of the atmosphere and ocean, there has been a long-term global warming trend underway since the early 1960s, as illustrated in Figure 1. The 1999 data are consistent with a continuation of that warming trend, with 1999 being approximately the sixth warmest year in the record. The ranking of years is approximate because of incomplete global coverage of measurement stations and small errors in the measurements.
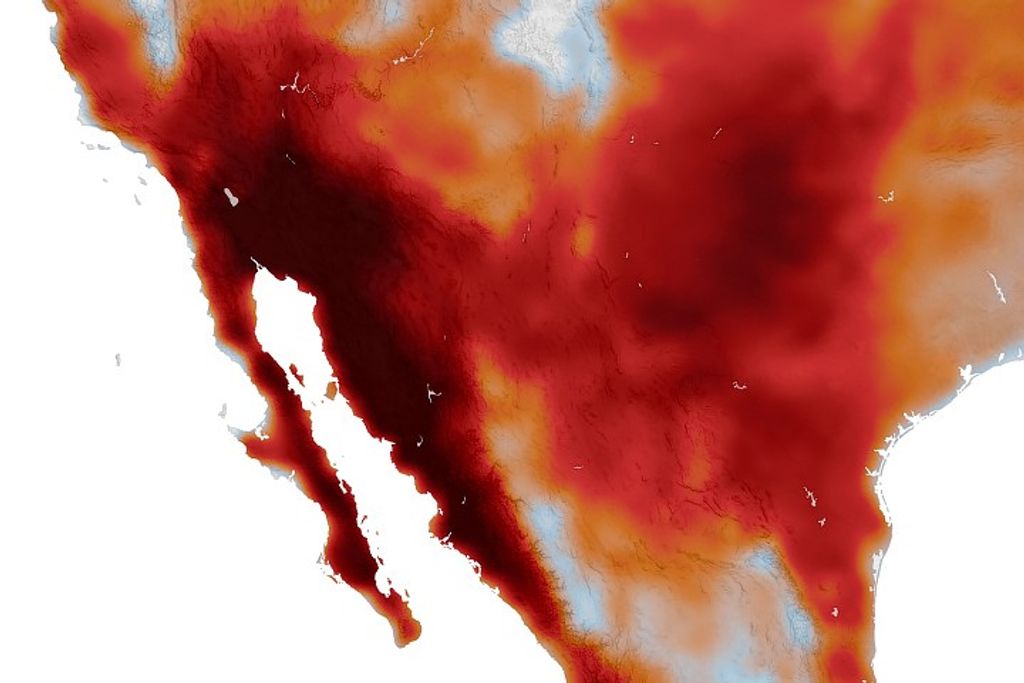
Most parts of the world were warmer than normal, i.e., warmer than the 30-year period 1951-1980, as illustrated in Figure 2. It was particularly warm across most of North America (except the West Coast) and most of Eurasia. However, the tropical Pacific Ocean was cool due to a strong La Niña. During a La Niña the near equatorial region is cooled by upwelling of cool water from the deep ocean.

The temperature in the United States was also warm, about 0.7°C above the 1951-1980 average (Figure 3). 1999 was approximately the 10th warmest year of the century. The warmest years in the United States occurred during the dust bowl era, with 1934 being the warmest year.
Our analyzed temperature, in the United States and the rest of the world, includes corrections for urban effects on the record. Nearby rural stations are used to adjust the long-term trends at urban stations, as described by Hansen et al. (1999) (see references below).
The temperature anomalies fluctuate substantially from month to month, as illustrated for the United States in Figure 4.
February and November were both exceptionally warm in the United States. Averaged over the year, most of the United States was warm in 1999 (Figure 5), except the West Coast and Florida.
These maps for the United States illustrate that even with the level of warmth that occurred in the United States in 1999, the local warming trend is less than natural year-to-year fluctuations of monthly mean temperature. Thus for any given location in the United States there are generally at least a few months in the year that are cooler than normal. But the overall tendency toward warming is enough that it is beginning to effect the probability of a month or a season being warmer than normal. In our discussion of 1998 temperatures (see below) we discussed this concept that the climate "dice" are being "loaded" to a degree that is beginning to be noticeable to people.
References
- Hansen, J., R. Ruedy, J. Glascoe, and M. Sato 1999. GISS analysis of surface temperature change. J. Geophys. Res. 104, 30997-31022.
- Reynolds, R.W. and T.M. Smith 1994. Improved global sea surface temperature analyses. J. Climate 7, 929-948.
NASA Earth Observatory by the Goddard Institute for Space Studies