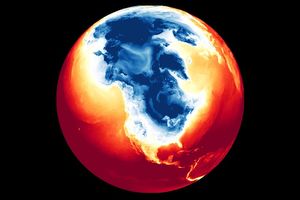


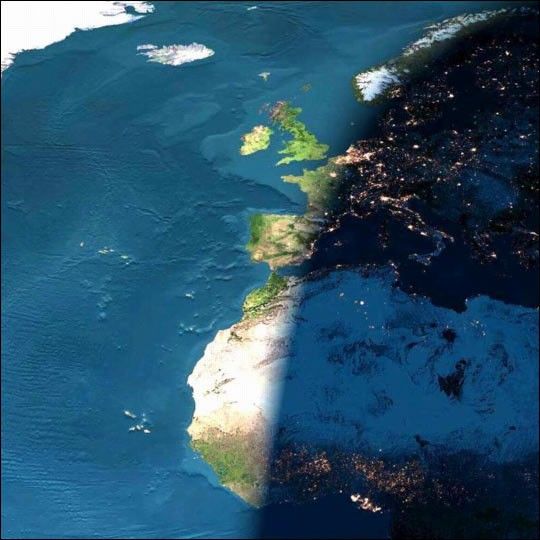
This image presents a remarkable view of the North Atlantic Ocean, stretching from the equator and western Africa northward to Iceland and Greenland, with sunset occurring over Scandinavia, France, Spain, Algeria, Mali, and the Ivory Coast. As you look at this image, think for a moment about how it was made. Is it a photograph? If so, was it taken from space? Is it a painting, a map, or something else?
Clues to interpreting this image can be found in features in the ocean, the clarity of the atmosphere, the appearance of land features in daylight and dark, the geography of the terminator (line of sunset), and the perspective (or field-of-view) of the image.
First, look at the ocean—close examination reveals that features on the sea floor are visible, including the continental shelf, and fracture zones associated with the Mid-Atlantic Ridge. Think about your beach experiences: How deep is the water at the beach before you can’t see the bottom any more? Visibility is limited to about a meter (3 feet) on the typical beach, ten meters (33 feet) in the clear waters such as the Caribbean. In fact, only half of one percent of the visible light that hits the surface of the ocean penetrates to 100 meters. Since the average depth of the oceans is 4000 meters (13,000 feet), even the most sensitive camera could not see the sea floor except along the very edge of the coast, and in exceptionally shallow areas. Because light can not penetrate deep ocean water, measurements of bathymetry—the depth of the oceans—are made from sonar mounted on ships and submersibles, and from space by radar altimeters. These data can then be shaded by a computer to show features on the ocean bottom.
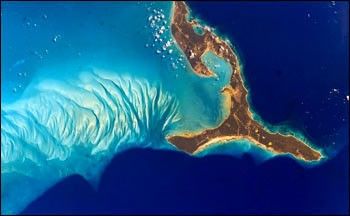
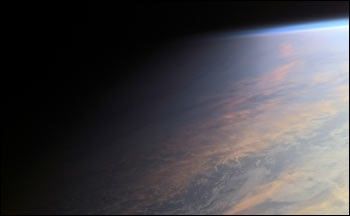
This photograph taken from the International Space Station shows the shallow sand bars to the west (left side) of Eleuthera Island in the Bahamas. The water there is only a few feet deep. To the east (right side) the seep water is a pure blue-no subsurface features are visible.
The next clue about this image: where are the clouds? Earth is a very cloudy planet—at any given time two thirds of the planet is covered by clouds. Look for yourself at the current cloud cover over Europe and North Africa from METEOSAT, a weather satellite 37,000 km (23,000 miles) above the Earth. However, this image is cloud free, suggesting that the image is a composite of many images with cloud-free sections, or that it was created by instruments that can see through clouds.
The appearance of the land provides more indications about the potential source of the image. Vegetated areas are green, and deserts are yellow, which is similar to what we would see with our eyes, or in a photograph. But the green vegetation is conspicuously bright. Plants absorb up to 95 percent of the visible light that falls on their leaves, so when observed from space in the visible part of the light spectrum, heavily vegetated landscapes appear very dark...almost black. On the other hand, near-infrared light—light with a wavelength just a little bit longer than red light, and invisible to our eyes—is reflected strongly by plants. Plants are bright in images made with near-infrared light, so perhaps this image uses near infrared data. Weather satellites that detect red and near infrared light have been collecting data for over twenty years—long enough to produce excellent cloud-free composite images. Furthermore, red and near-infrared data can be combined in a way to simulate color imagery.

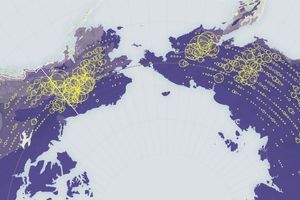
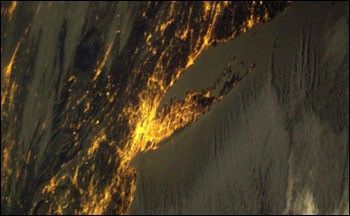
Now look at the terminator—the line separating the sunlit side of the Earth from the nighttime areas. The city lights on the night side are brighter than the day lit countryside! This can’t be from a single image—artificial lights are much dimmer than reflected sunlight, which is why cameras need special film and long exposure times to record an image at night. Cameras and scientific instruments can also only detect a limited range of brightness at one time, so it is impossible for one photo to show detail in the daytime and nighttime simultaneously. To date, only one remote-sensing instrument, the Defense Meteorological Satellite Program (DMSP) Operational Line Scanner, has been used to map lights at night. Scientists compiled data from this satellite from October 1994 through March 1995 to create a global map of city lights. The city light data does not contain any surface features, so they must be combined with a daytime surface image (shaded to simulate a nighttime view) to create a “night side” Earth. This night side image was then combined with the daytime composite image, with a computer-generated terminator separating the two.
Since the Earth is spherical, the terminator should always appear to be an arc when viewed from space, or a straight line if seen from directly above. But, in this image, the terminator changes shape, from a straight line near the bottom of the image to a curve at the top. The terminator changes shape because the curved surface of the Earth has been projected onto a flat surface, just like a map.
Final clues about this image’s origin are provided by the image field-of-view, which encompasses a sweeping territory extending from the equator north to about 65 degrees North latitude, and roughly 60 degrees of longitude from 30 degrees East (the mid Atlantic) to 30 degrees West…a footprint of more than 6500 km (4000 miles) to a side. The Space Shuttle and International Space Station fly at an altitude of about 375 km (230 miles). Even from this altitude, the widest view that can be captured by a camera looking obliquely is a footprint that is roughly 1500 km (930 miles) on a side. Satellites such as weather satellites in geosynchrounous orbit 37,000 km (23,000 miles) above the Earth’s surface) have sweeping views of large portions of the planet, but the only people to have seen such a broad view of the Earth were the Apollo astronauts on the way to the Moon.

By dissecting this image, we’ve learned that it is composed of many elements, collected by a variety of instruments, at different times and places, with several wavelengths of light (and even sound)—combined in a computer to create an "impossible" view of the Earth. Scientists use images like this—called visualizations—to interpret complex data, and communicate their understanding to others.
The image itself was generated by the Earth and Moon Viewer, a Web-based tool that produces Earth imagery from several perspectives. The Earth daylit and night time images were developed by The Living Earth.
NASA Earth Observatory story by Robert Simmon.