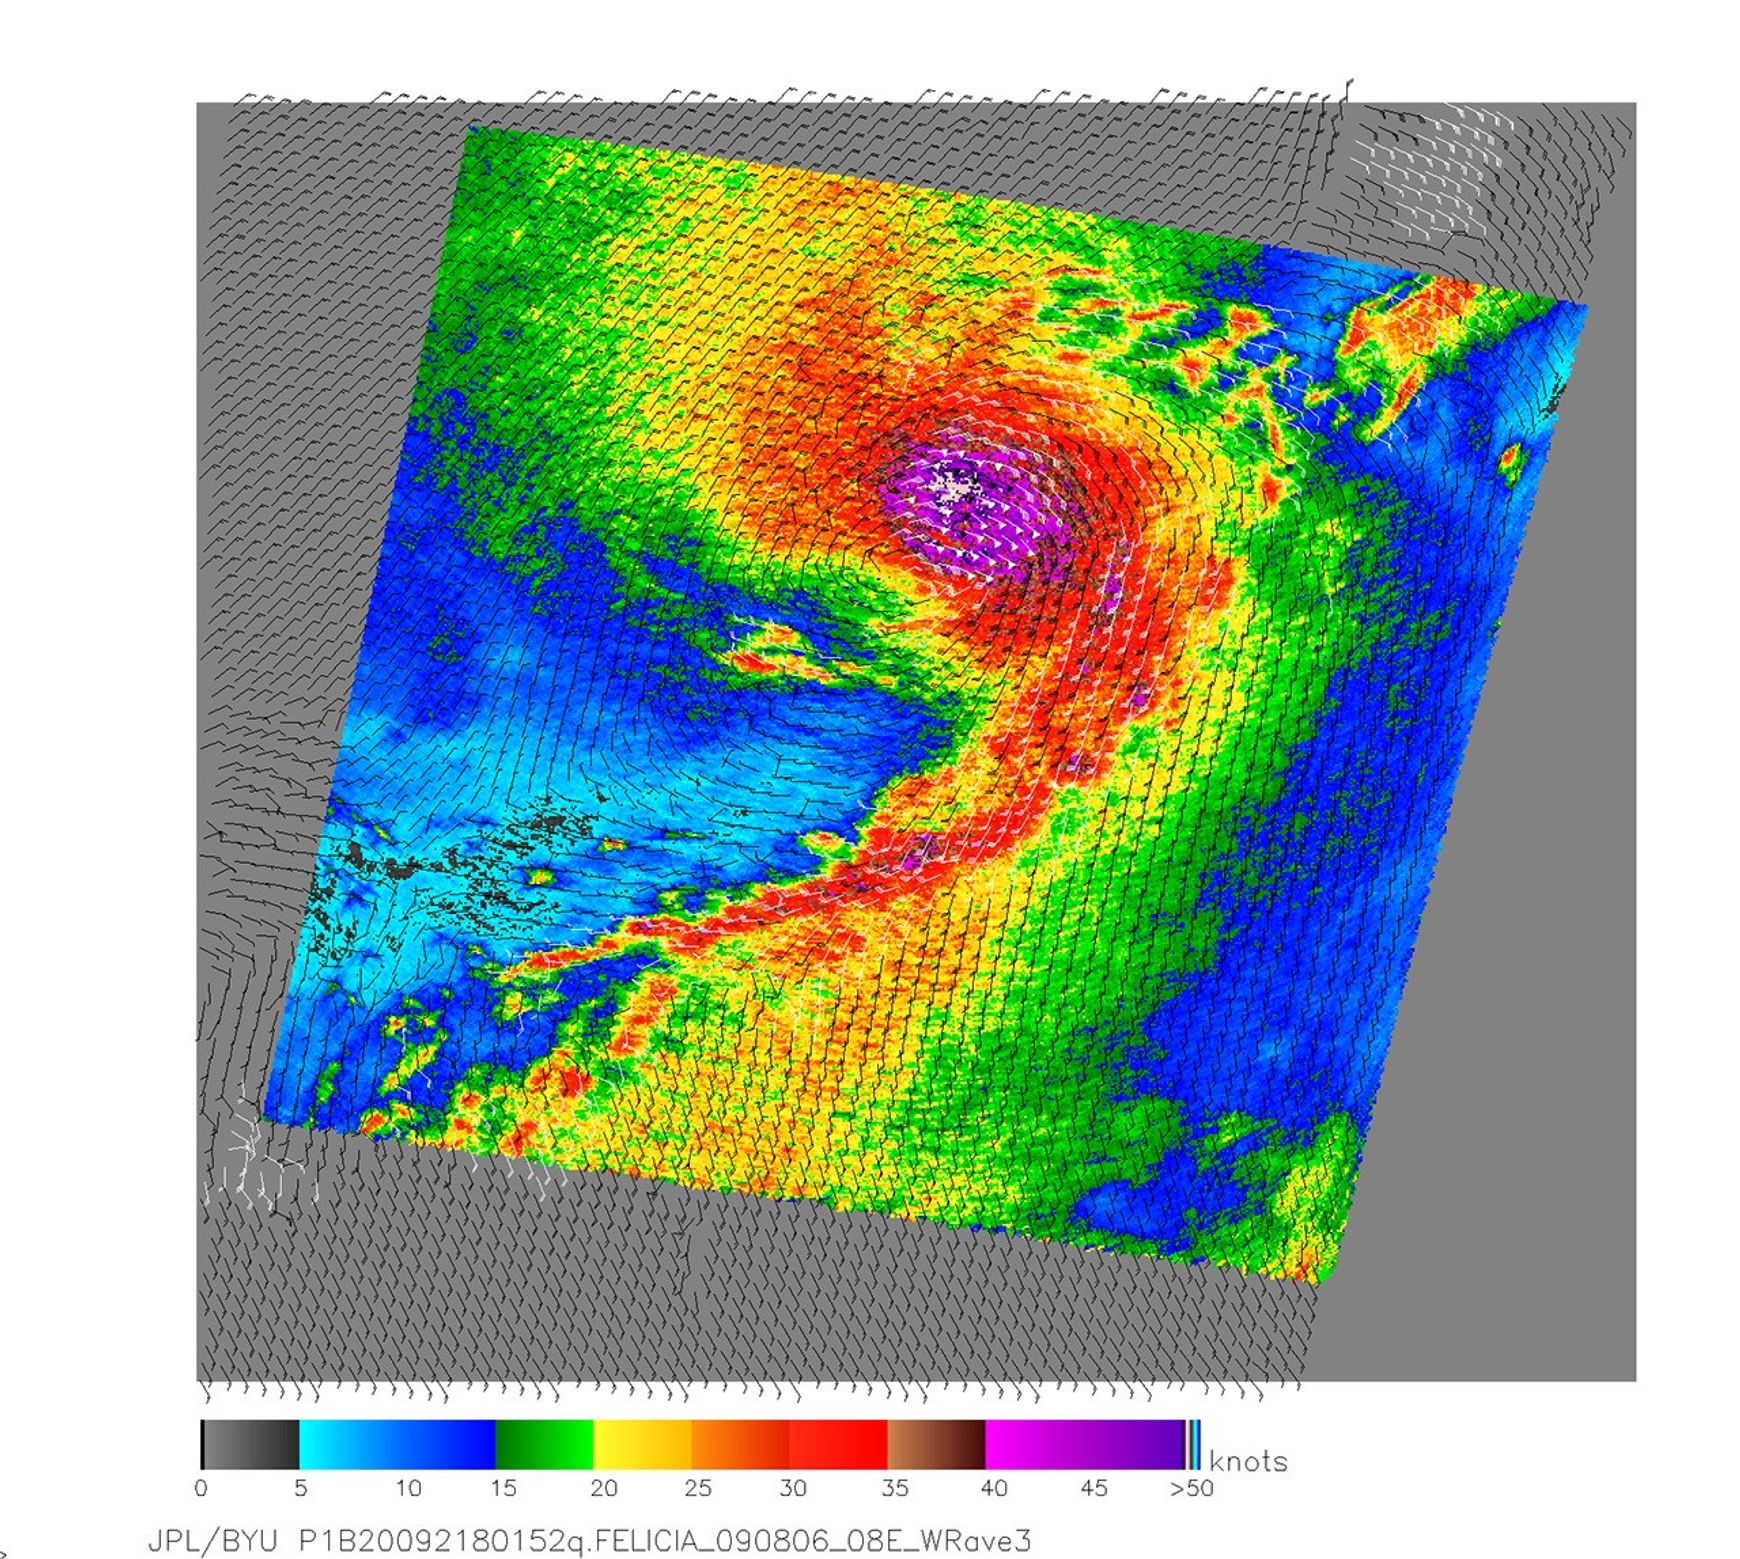


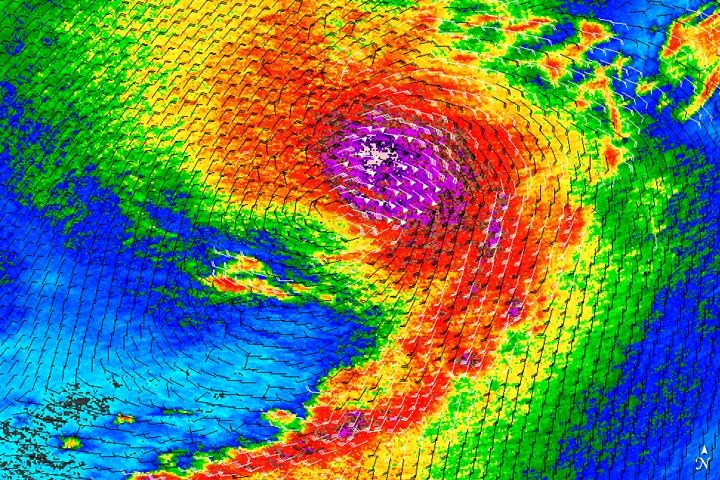
Hurricane Felicia was a dangerous Category 4 hurricane on August 6, 2009, when NASA’s QuikSCAT satellite captured the data used to make this image. The image depicts wind speed in color and direction with barbs. Both measurements reveal the structure of the storm. Felicia had a compact, strong center, surrounded by distinctive bands of strong wind. One band extends far to the south, making the storm look like a comma. The northern bands of the storm reach beyond the edge of the image.
QuikSCAT measures wind speeds over the ocean by sending pulses of microwave energy through the atmosphere to the ocean and measuring the energy that bounces back from the wind-roughened surface. The energy of the microwave pulses changes depending on wind speed and direction, giving scientists a way to monitor wind around the world. Intense rain rippling on the ocean’s surface and the relative rarity of the extreme winds seen in a tropical cyclone make it difficult to accurately measure wind speeds above 50 knots using the satellite scatterometer. QuikSCAT images provide, instead, a valuable picture of the wind structure within the storm.
References & Resources
- National Hurricane Center. (2009, August 6). Hurricane Felicia Advisory Archive. National Weather Service. Accessed August 6, 2009.
NASA image courtesy the QuickScat Science Team at the Jet Propulsion Laboratory. Caption by Holli Riebeek.