


The climate pattern known as the El Niño-Southern Oscillation, or “ENSO” for short, is the biggest cause of large-scale climate variability in the tropics. During an El Niño episode, the central and eastern Pacific Ocean are warmer than normal. The above-normal sea surface temperatures are maintained by gentle but giant waves of warm water that slosh across the Pacific from Indonesia toward South America.
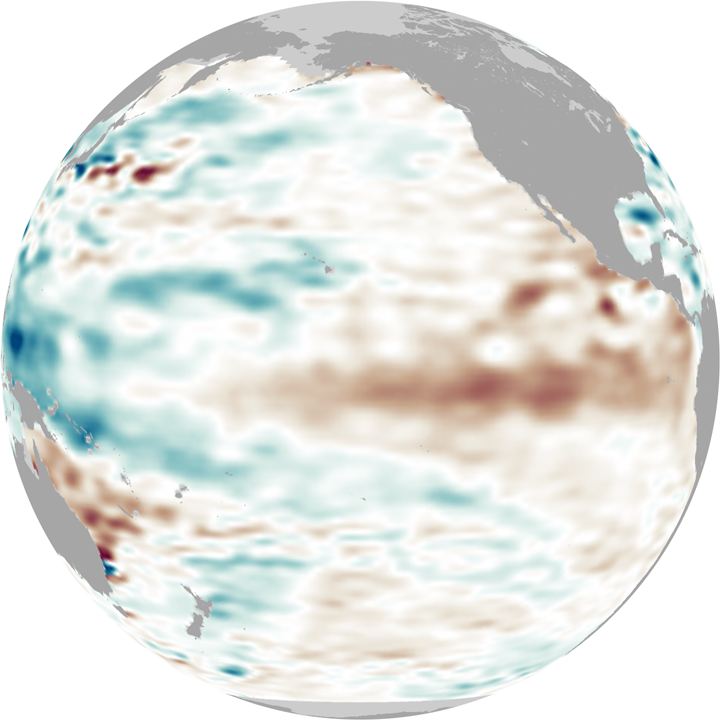
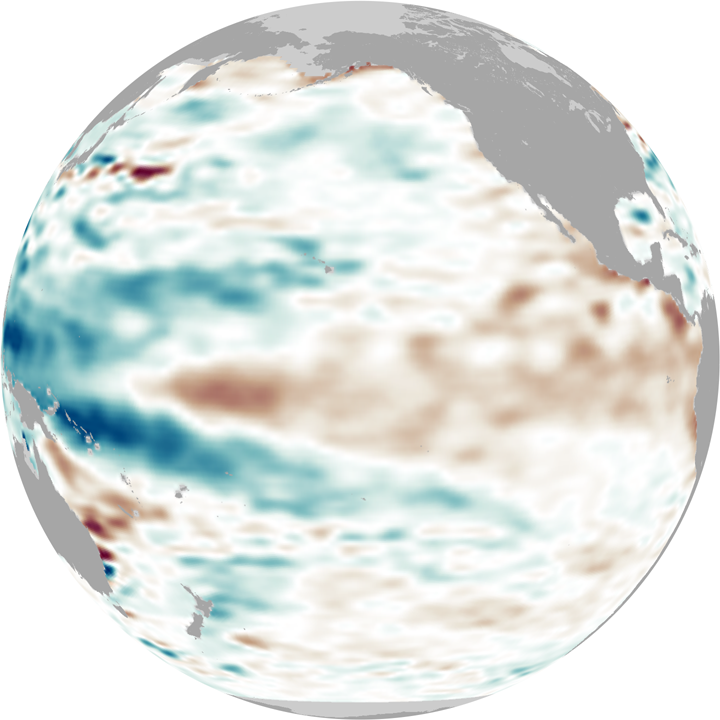
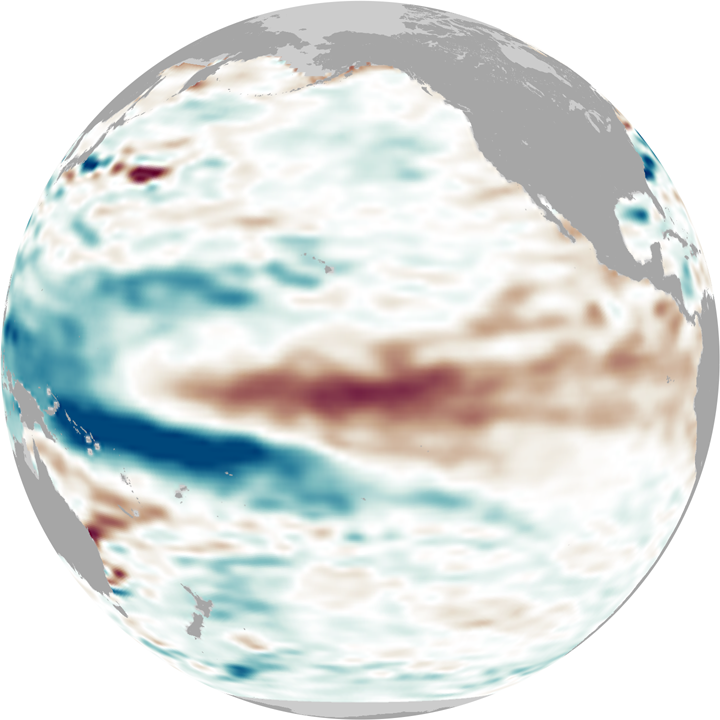
This series of globes shows the eastward progression of one of these deep Kelvin waves in February 2010. The globes show sea surface height anomalies, which means places where the water surface is higher (red) or lower (blue) than average. A higher-than-average sea surface height at a given location indicates that there is a deeper-than-normal layer of warm water. Lower-than-average sea surface height indicates a shallower layer of warm water. The globes are based on 10 days of data centered on January 15, January 30, and February 15.
In January (left-hand globe), sea surface heights across the central and eastern equatorial Pacific were elevated (red), but not extremely so, potentially a sign that El Niño was weakening. But in early February, a strong sea level anomaly appeared northeast of Australia (center globe). This swell of deep, warm water is the start of the Kelvin wave, and by late February, it had spread eastward into the central Pacific (right-hand globe) and re-invigorated the current El Niño.
Where do Kelvin waves come from? Under normal conditions, the tropics’ prevailing easterly winds push Sun-warmed surface waters across the Pacific from the Americas toward Indonesia, creating a deep pool of warm water in the western Pacific. During an El Niño, the trade winds falter, and sometimes even reverse, for months. When the winds that maintain the warm pool falter, a large pulse of warm water from the western Pacific slides back toward the east. The most current sea surface height images are available on the JASON mission sea level Webpage.
References & Resources
- Phillips, T. (2002). A Curious Wave. Science@NASA Website. Accessed March 11, 2010.
- National Oceanic and Atmospheric Administration Climate Prediction Center. (2010, March 4). El Niño/Southern Oscillation (ENSO) Diagnostic Discussion. National Weather Service/Climate Prediction Center Website. Accessed March 11, 2010.
- Thompson, D. (2007). A Brief Introduction to the Annular Modes and Annular Mode Research. Colorado State University’s Department of Atmospheric Science Website. Accessed March 11, 2010.
NASA Earth Observatory images by Jesse Allen, Kevin Ward, and Robert Simmon. Caption by Rebecca Lindsey, based on interpretation provided by Josh Willis and Bill Patzert, NASA JPL.