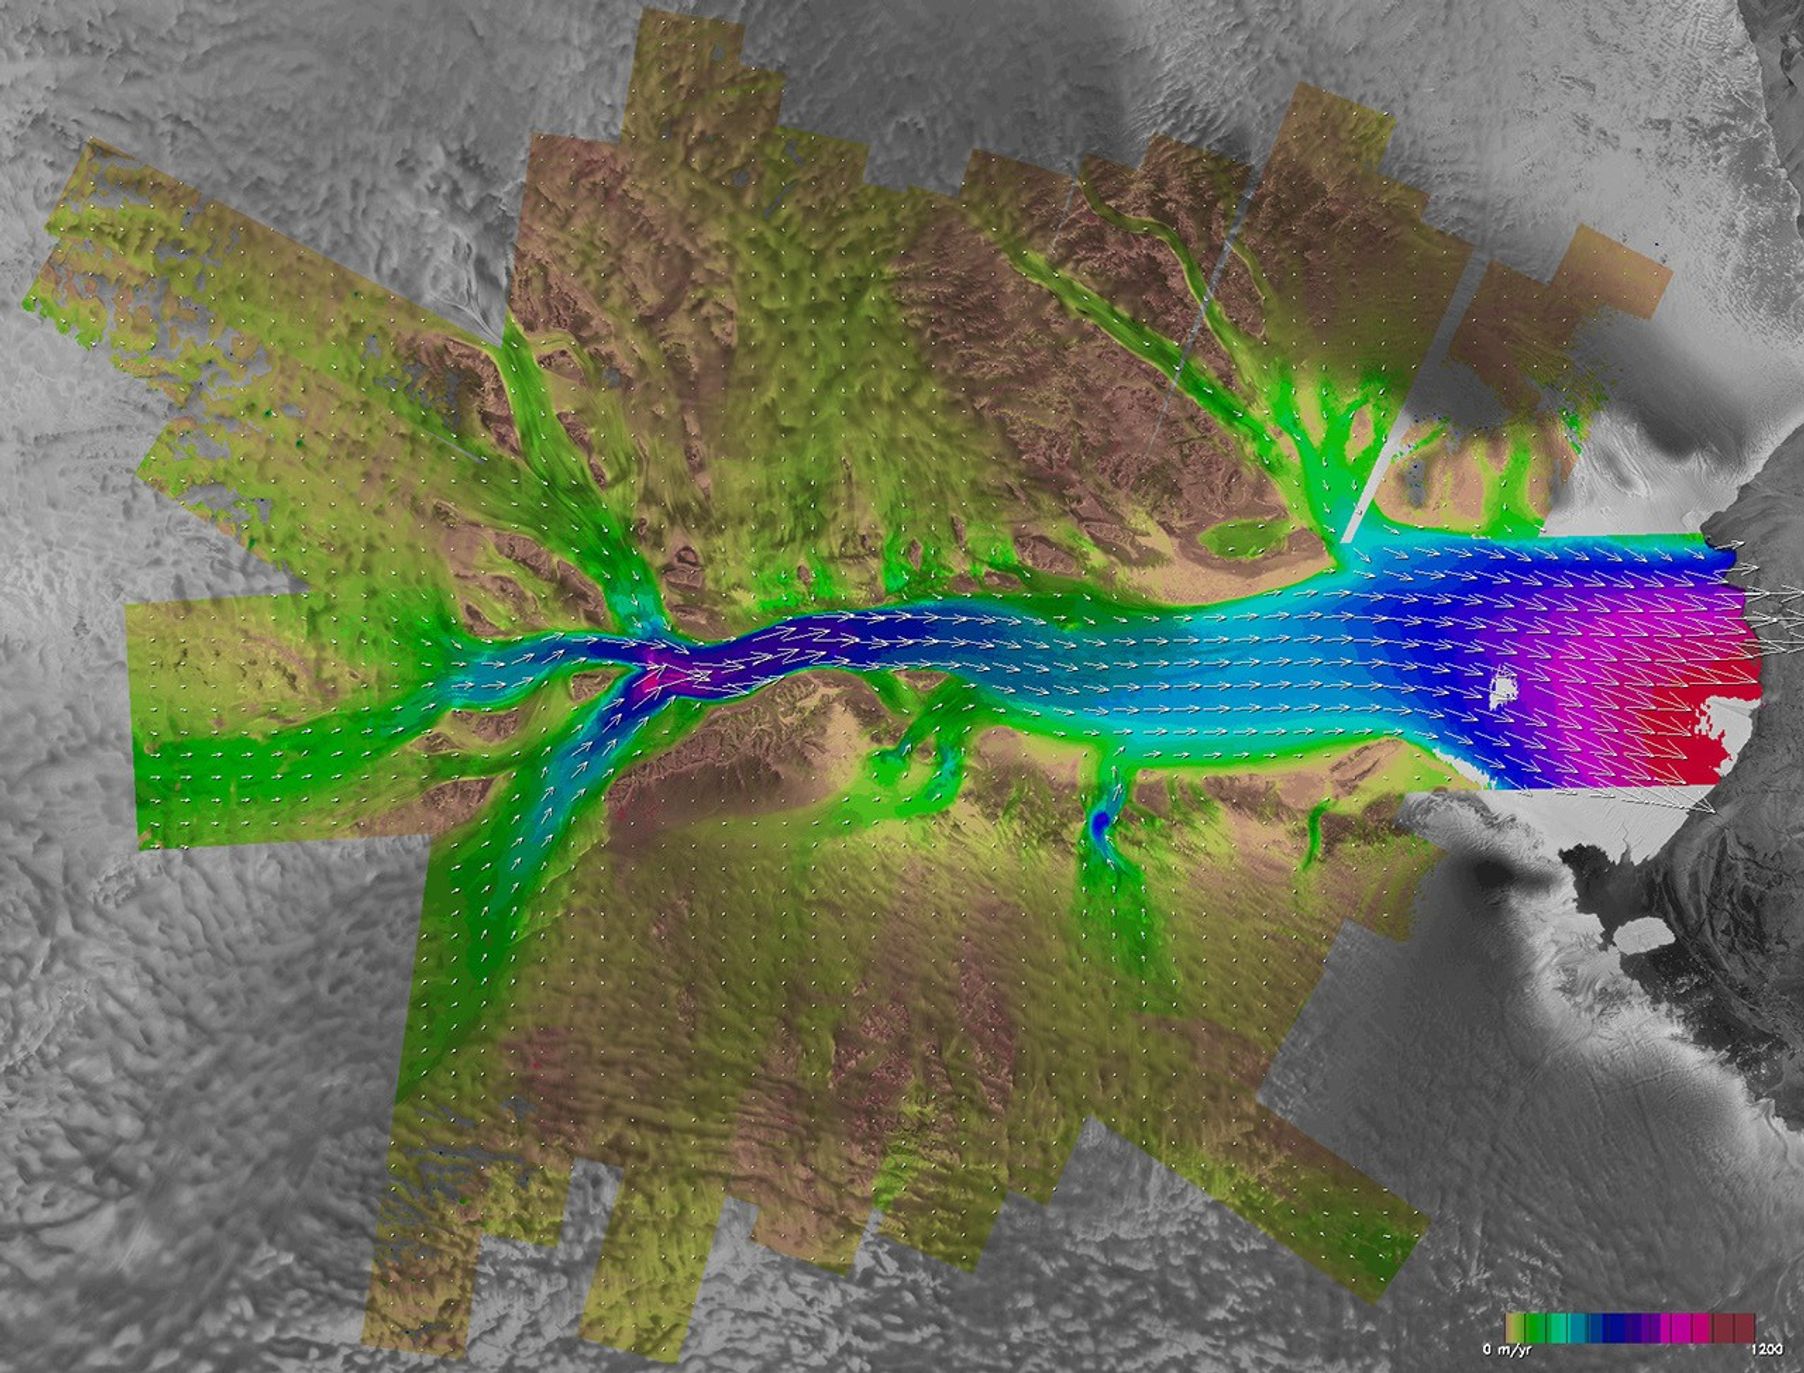


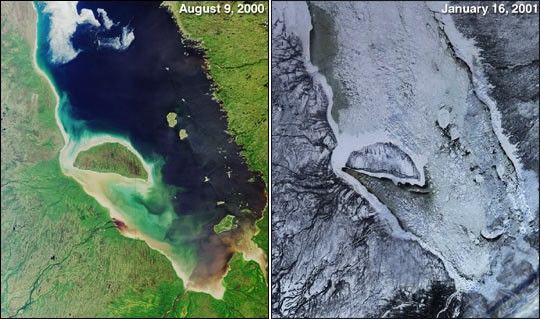


This image shows the movement of the Lambert Glacier. The icevelocity vectors were obtained by using RADARSAT Synthetic Aperture Radar (SAR) imagery fromthe 2000 Antarctic Mapping Mission. Yellow represents the areasof no motion, which are either exposed land or stationary ice.The smaller confluent glaciers have generally low velocities,shown in green, of 100-300 meters (330-980 feet) per year, whichgradually increase as they flow down the rapidly changingcontinental slope into the upper reaches of the faster flowingLambert Glacier.
Most of the Lambert Glacier itself has velocities between 400-800meters (1,310-2,620 feet) per year, with a slight slowing in themiddle section. As the glacier extends across Amery Ice Shelf,velocities increase to 1000-1200 meters (3,280-3,937 feet) peryear as the ice sheet spreads out and thins. Only a handful ofin-situ velocity measurements have been previously reported ofthis huge glacier system. While the in-situ and radar-derivedmeasurements appear to be qualitatively similar, the extent andaccuracy of the new measurements are unprecedented and providequantitative baselines for future comparisons. The icevelocities are obtained from pairs of images obtained 24 daysapart, using a technique called radar interferometry. Thistechnique enables a highly precise alignment of image pairs thatprovides accurate measurements of topography as well as surfacesthat have changed or moved over the short time interval,including glaciers.
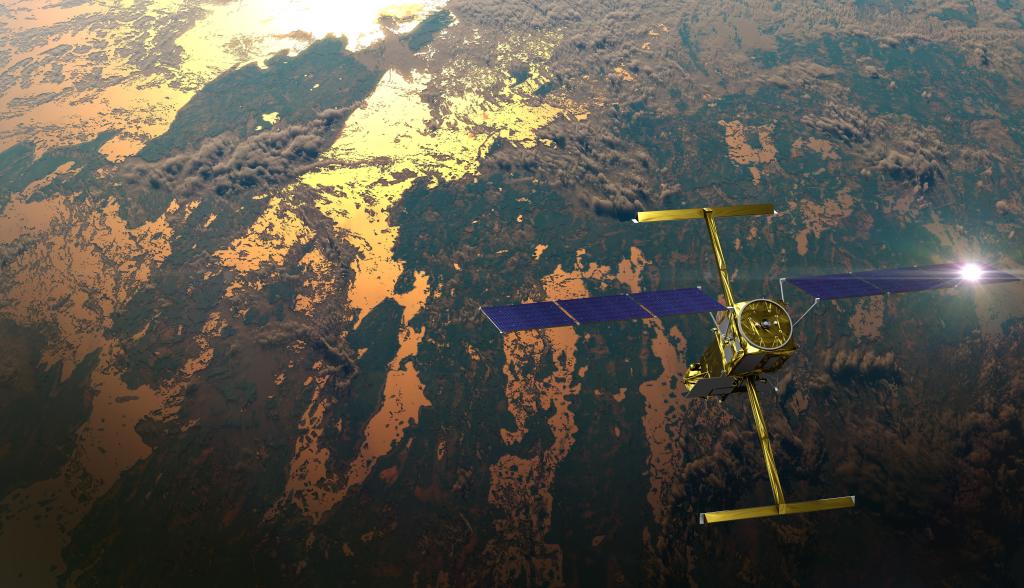
The Antarctic Mapping Mission is a joint project between NASA andthe Canadian Space Agency. The project is led by Ohio StateUniversity in Columbus in partnership with the Alaska SyntheticAperture Radar (SAR) Facility at the University of AlaskaFairbanks, NASA's Jet Propulsion Laboratory, Pasadena, Calif.,and the Vexcel Corporation, Boulder, Colo. The Canadian SpaceAgency's RADARSAT-1 satellite carries a synthetic aperture radar,an imaging radar sensor that operates at C-band (5.3 GHzfrequency) with horizontal transmit-horizontal receivepolarization from an orbital altitude of about 800 kilometers(500 miles). The 1997 Antarctic Mapping Mission took placebetween Sept. 19 and Oct. 14 and mapped the entire Antarcticcontinent. The 2000 Antarctic Mapping Mission lasted from Sept. 3to Nov. 4 and obtained complete coverage of Antarctica north of82 degrees south latitude.
More information on the mission is available on the Internet at http://www-bprc.mps.ohio-state.edu/radarsat. Images associated with this release areavailable at http://www.jpl.nasa.gov/pictures/antarctica/ .
Information about the first Antarctic Mapping mission is available fromthis Candian Space Agency web site.
References & Resources
Image courtesy Canadian Space Agency/NASA/Ohio State University, Jet Propulsion Laboratory, Alaska SAR facility