


![Request for Information – Potential [Placeholder for Prize]](https://assets.science.nasa.gov/dynamicimage/assets/science/psd/solar/2023/09/s/solarsystem_0.jpg?w=1024)


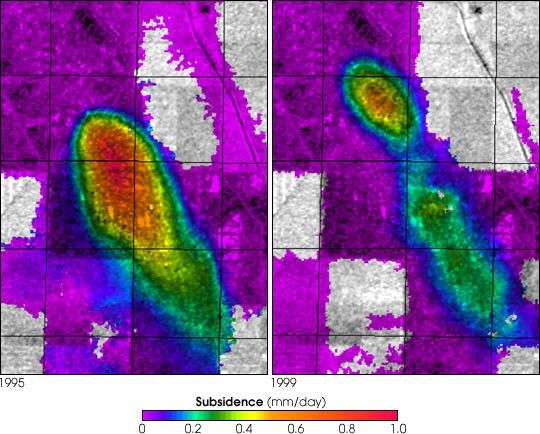
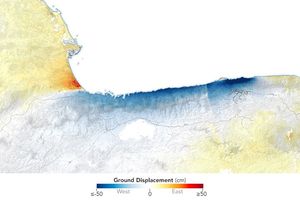
This figure shows a comparison of interferograms from four different years mapping the rapid ground subsidence over the Lost Hills oil field in California. Lost Hills is located about 60 km (40 miles) northwest of Bakersfield in the San Joaquin Valley. The oilfield is about 1.5 km (1 mile) wide and 6 km (3.5 miles) long.
Each interferogram was created using pairs of images taken by synthetic aperture radar that have been combined to measure surface deformation or changes that may have occurred in the time between when data for the two images were taken. The images were collected by the European Space Agency’s Remote Sensing satellites (ERS-1 and ERS-2) in two months of each year shown (1995, 1996, 1998 and 1999) and were combined to produce these image maps of the apparent surface deformation, or changes.
The interferometric measurements that show the changes, primarily vertical subsidence of the surface, are rendered in color with purple indicating no motion and the brightest red showing rapid subsidence. The white areas are where the radar measurements could not be obtained, mostly in the agricultural fields around the oilfields where plant growth or plowing altered the radar properties of the surface.
These radar data show that parts of the oilfield were subsiding unusually rapidly, more than 3 centimenters (1.2 inches) a month, in 1995 and 1996. They also reveal that while the ground subsidence rate decreased in the center part of the oilfield, it increased in the northern part between 1995 and 1996 and 1998 and 1999.
Subsidence maps like these combined with records of oil and water extraction and injection will help scientist understand how the rocks within an oilfield are behaving, leading to improvements in oilfield operations.
For more information, read Radar Helps Monitor Oil Fields.
References & Resources
Images courtesy Eric Fielding, NASA Jet Propulsion Laboratory