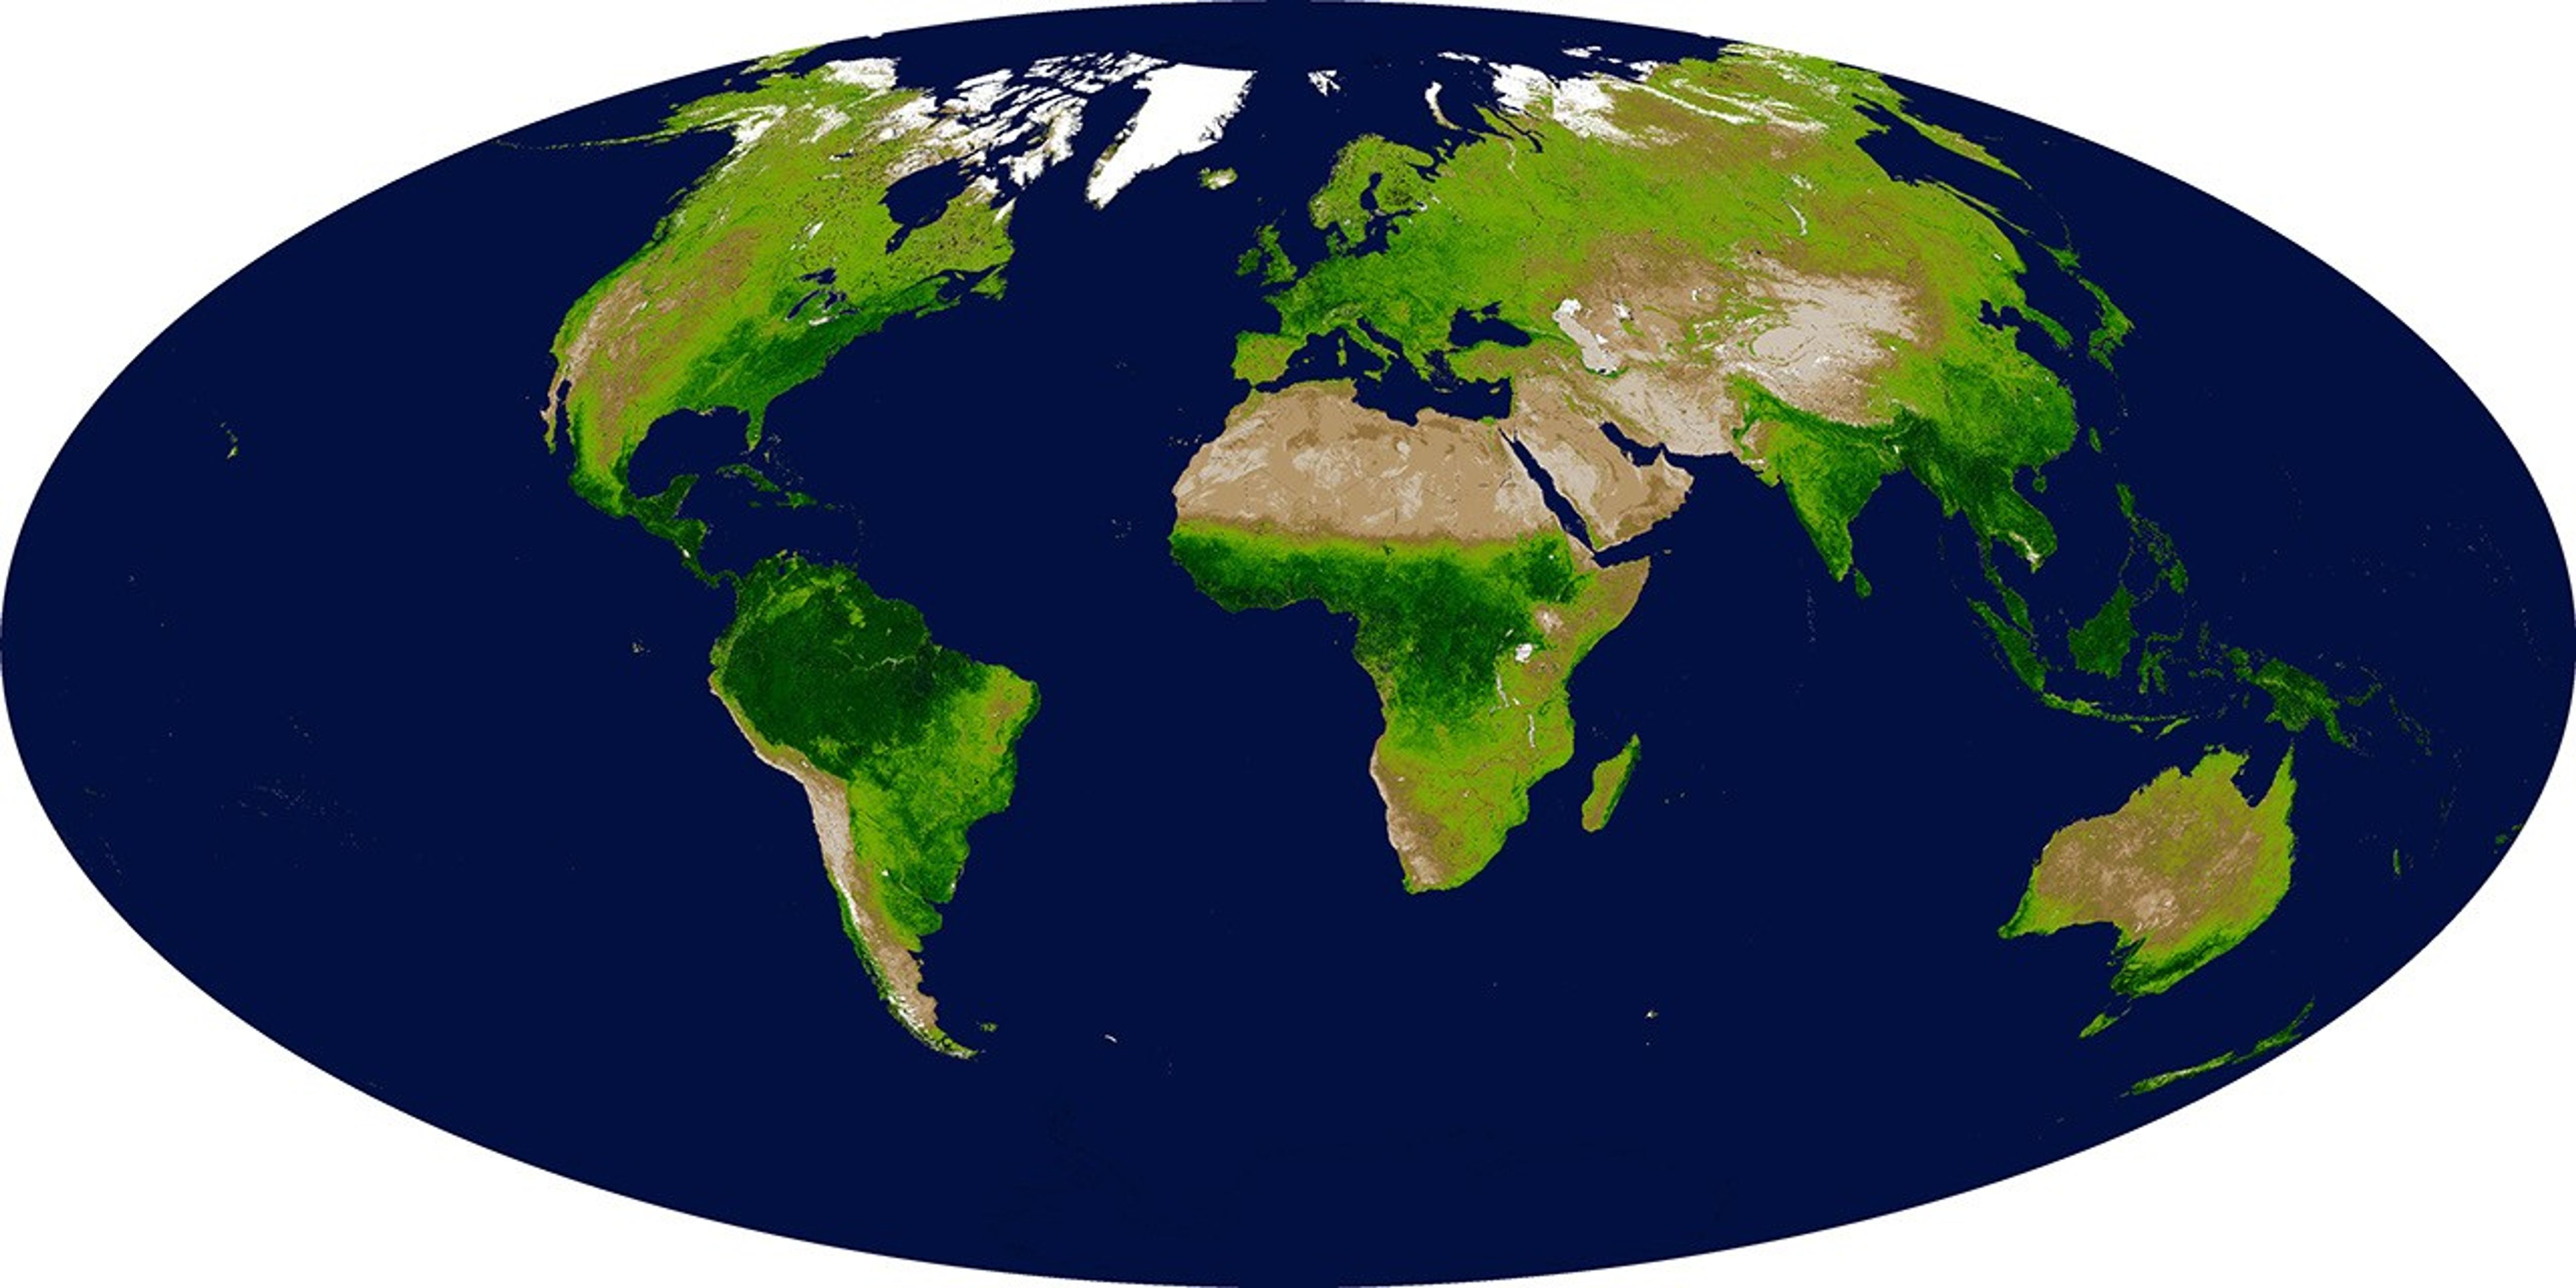











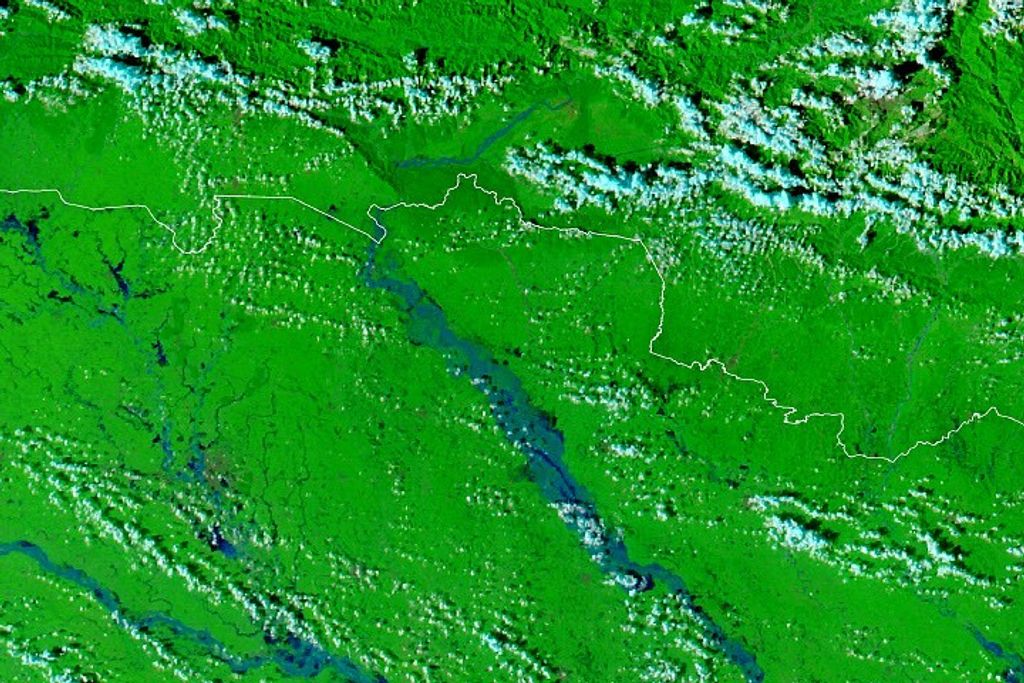




By carefully measuring the wavelengths and intensity of visible andnear-infrared light reflected by the land surface back up into space,the Moderate-resolution Imaging Spectroradiometer (MODIS) Team canquantify the concentrations of green leaf vegetation around the world.The above MODIS Enhanced Vegetation Index (EVI) map shows the density ofplant growth over the entire globe. Very low values of EVI (white andbrown areas) correspond to barren areas of rock, sand, or snow. Moderatevalues (light greens) represent shrub and grassland, while high valuesindicate temperate and tropical rainforests (dark greens). The MODIS EVIgives scientists a new tool for monitoring major fluctuations invegetation and understanding how they affect, and are affected by,regional climate trends.
For more information, read NASA Unveils Spectacular Suite of New Global Data Products from MODIS.
References & Resources
Image courtesy MODIS Land Group/Vegetation Indices, Alfredo Huete, Principal Investigator, and Kamel Didan, University of Arizona.