


high resolution images:
map of impervious surfaces (4.2 MB)
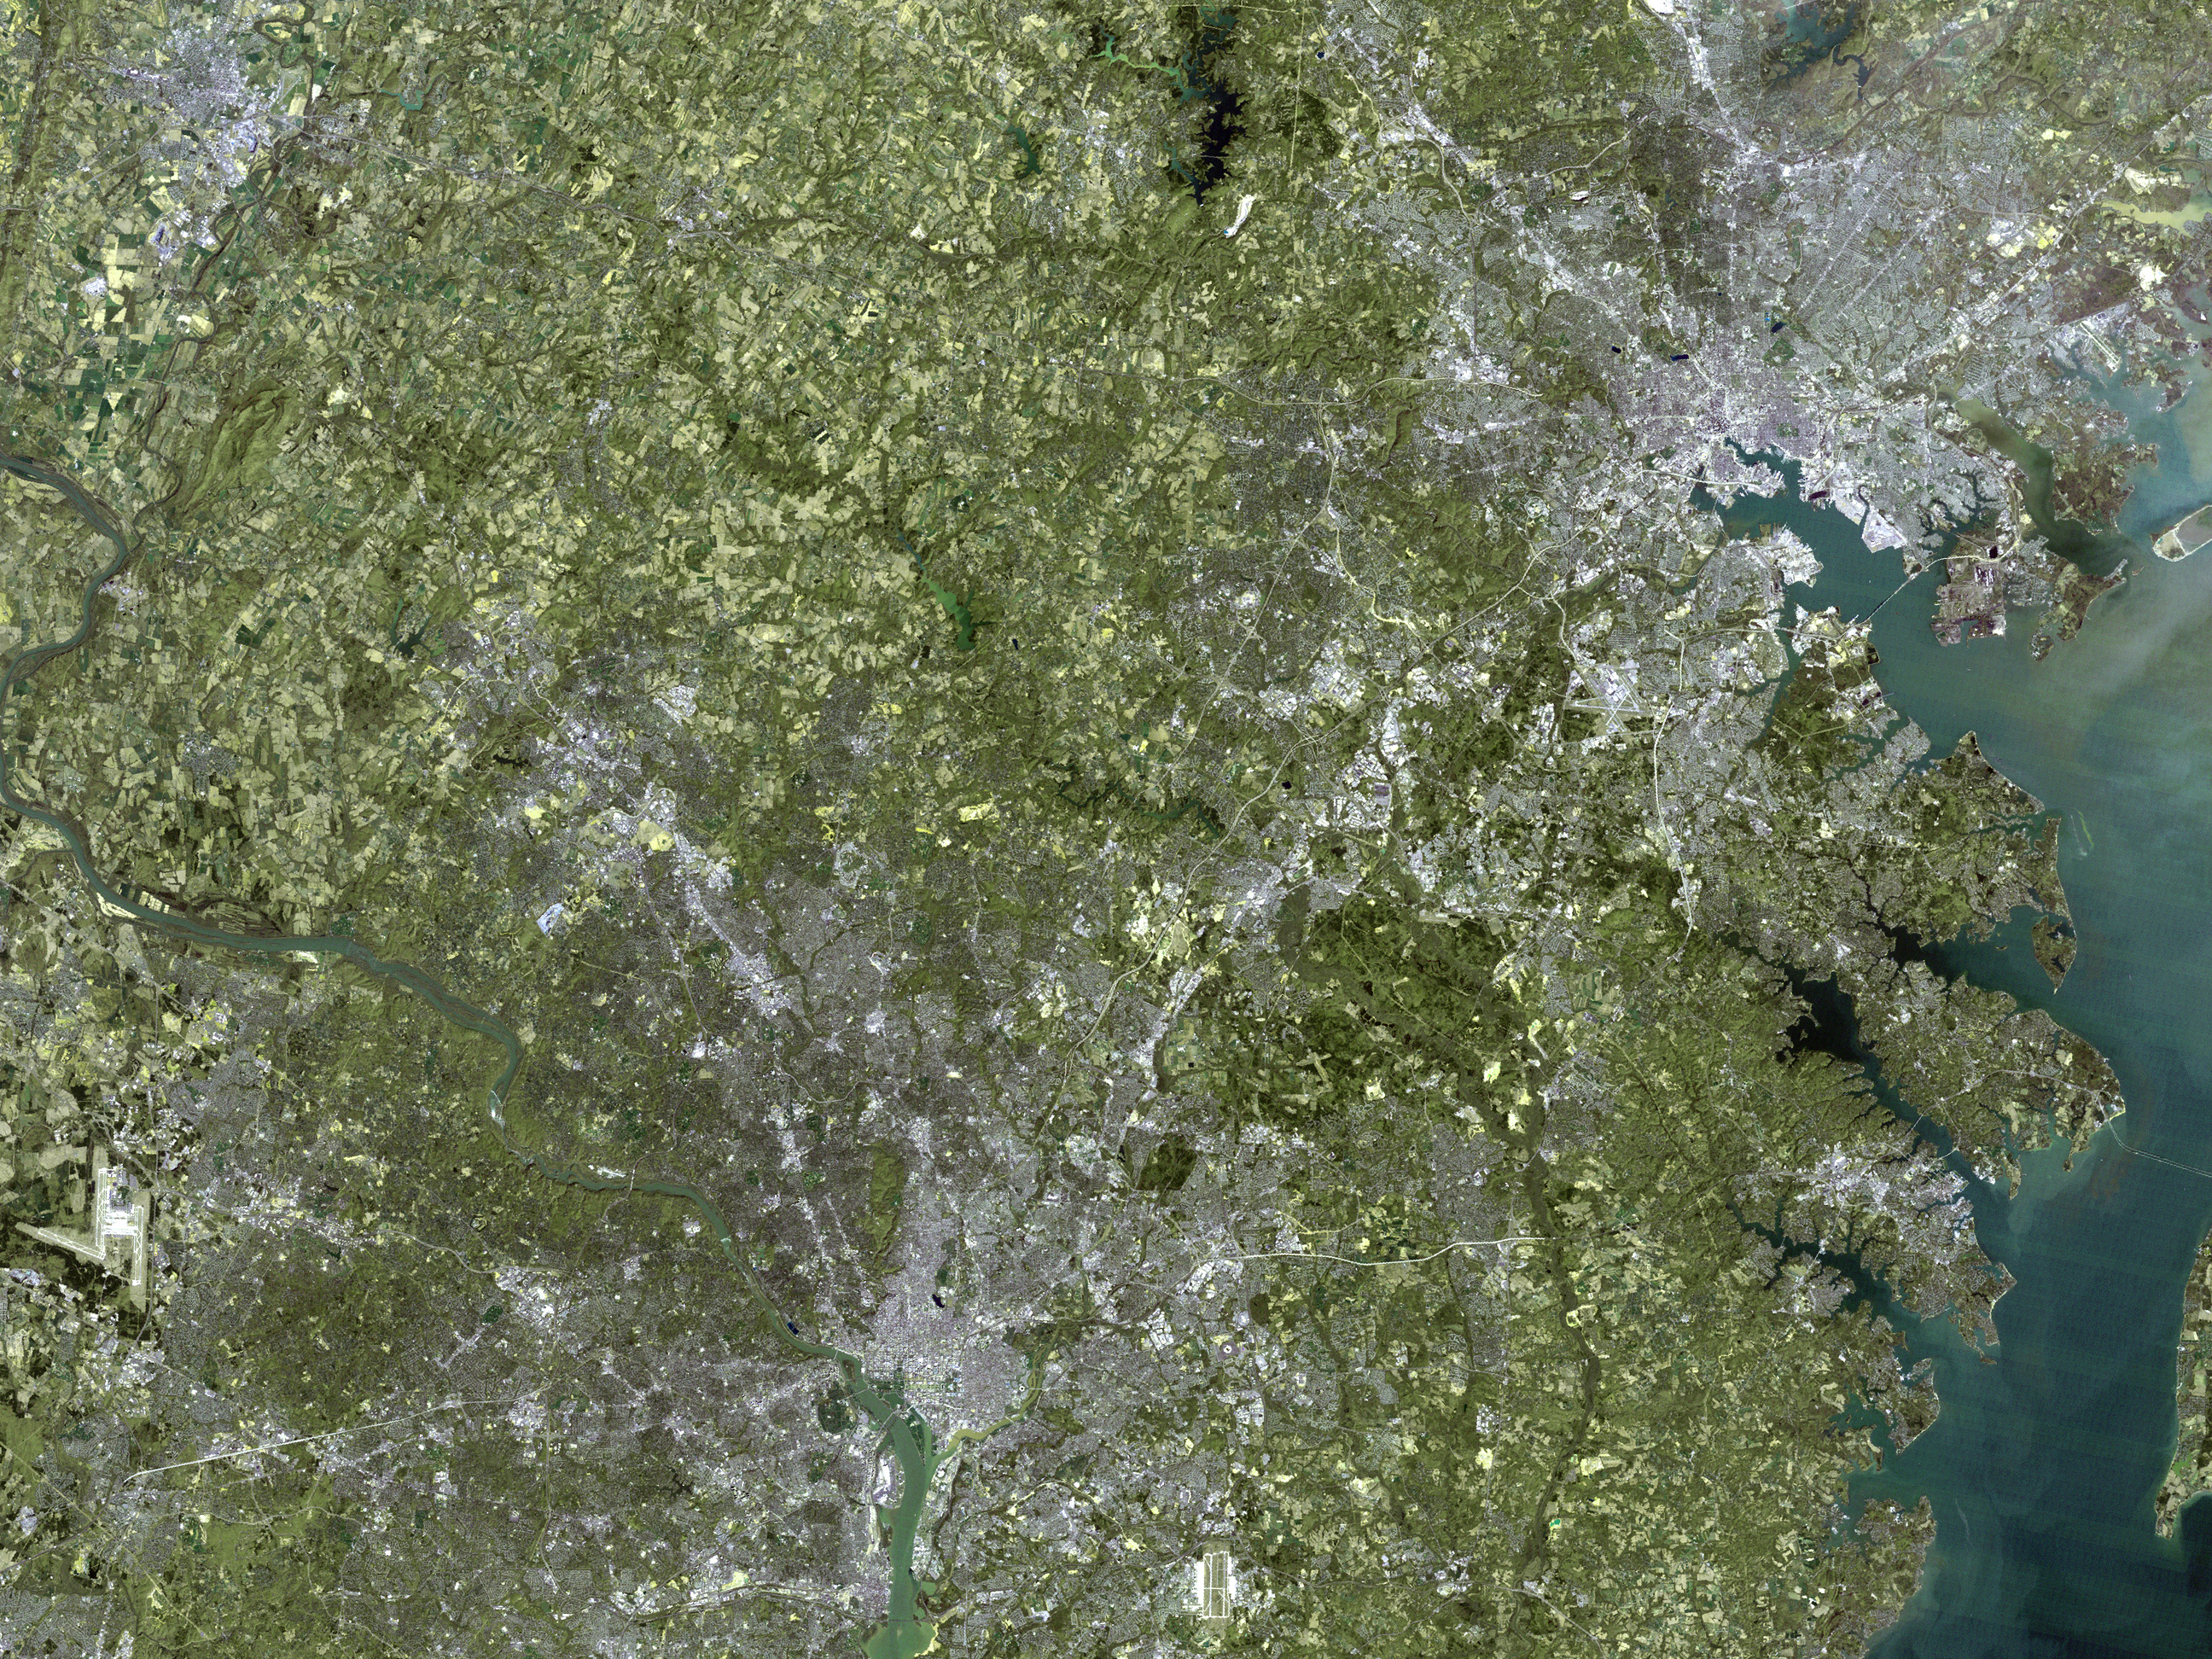
true-color image (3.1 MB)
Scientists are using a major advance in satellite-based land surface mapping to createmore accurate and detailed maps of our cities. These maps provide urban planners with a better understanding of city growth andhow rainfall runoff over paved surfaces impact regional water quality.
These space-based maps of buildings and paved surfaces, such as roadsand parking lots, which are impervious to water, can indicate where large amounts of storm water runs off. Concentrated runoff leads toerosion and elevated discharge of soil and chemicals into rivers, streams, and ground water.
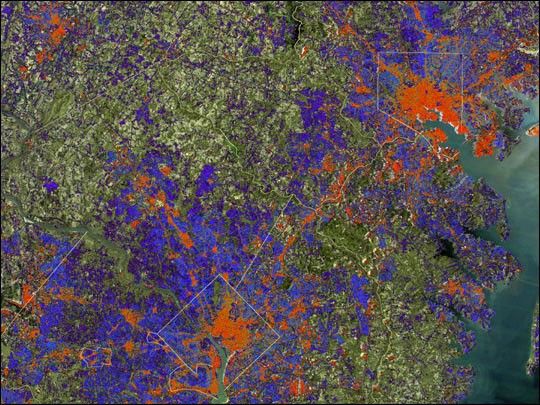
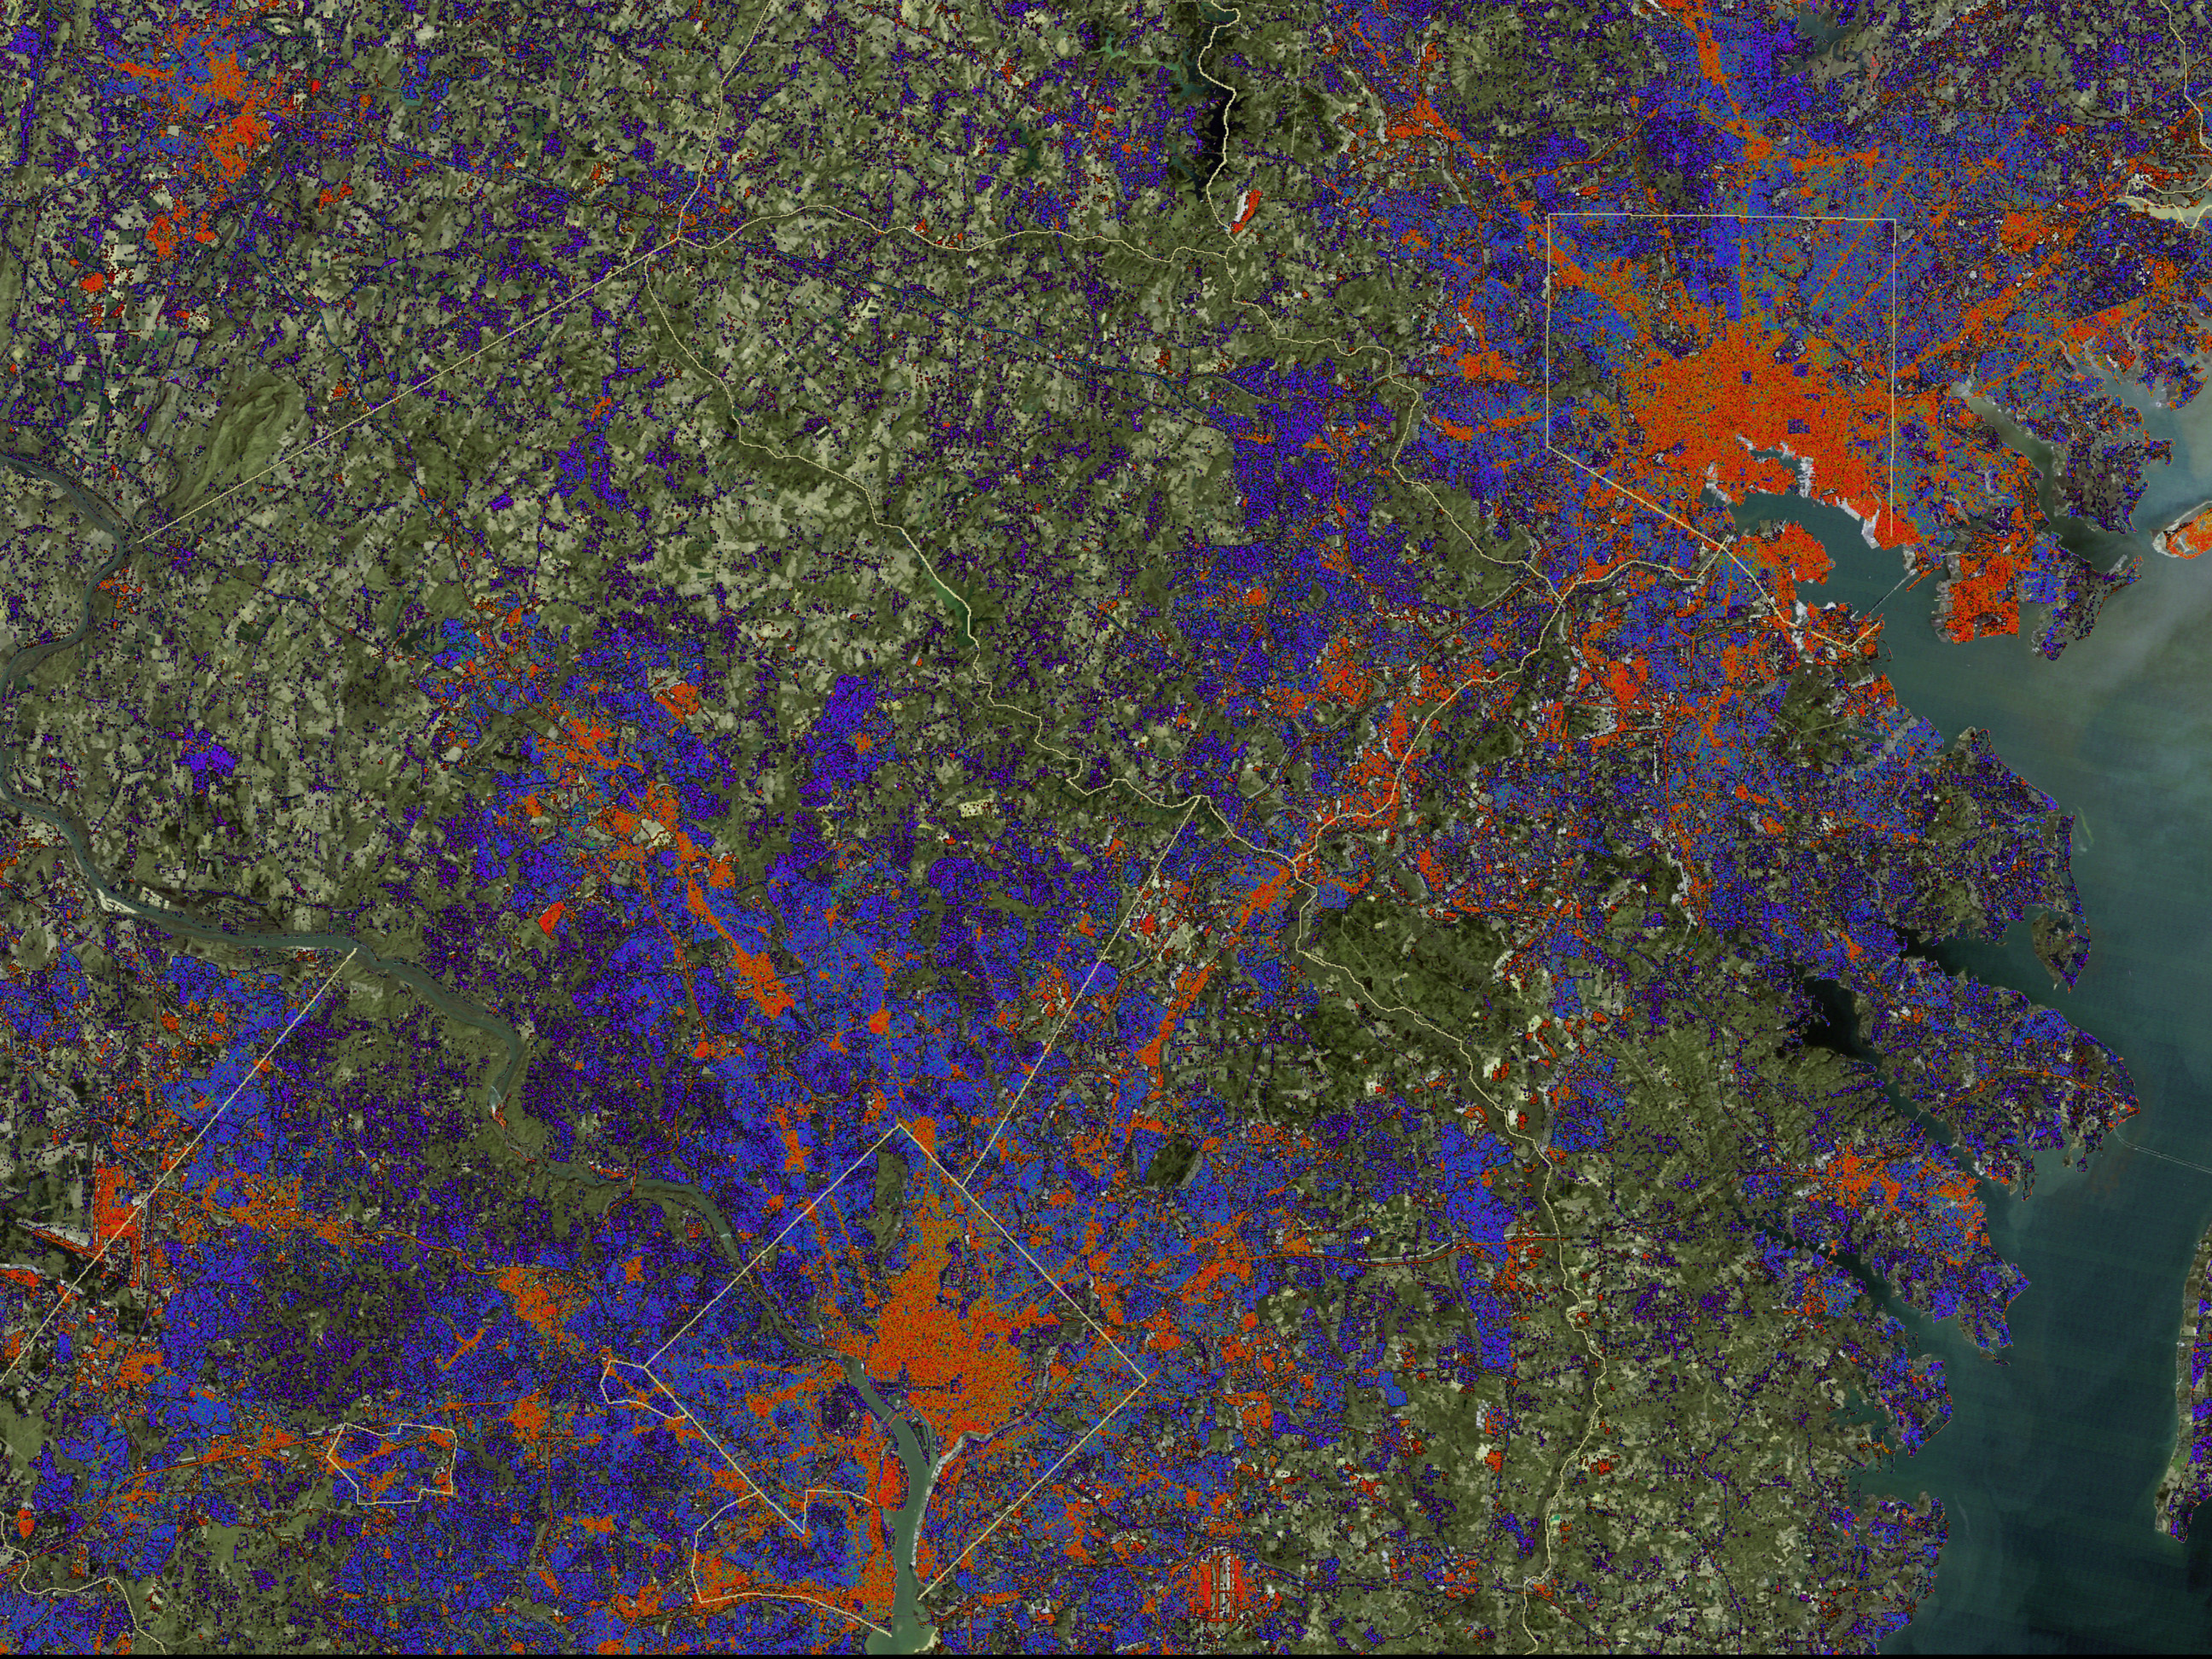
Andrew Smith, a faculty research assistant at the Mid-Atlantic RegionalEarth Science Applications Center produced a map of theWashington-Baltimore area that quantifies how much impervious surfacethere is across the entire region. Baltimore and the counties thatborder it have at least 20 percent, and up to 40 percent, impervioussurface area, indicating that pollution from runoff could be a problem.The District of Columbia and surrounding watersheds in Virginia andMaryland have levels of impervious surfaces between 20 percent and 30percent percent. Areas between and beyond the Baltimore-Washingtoncorridor are more "green" with levels that range from 0 percent to 20percent impervious surface areas.
The image above shows the extent of impervious surfaces in and aroundWashington and Baltimore. Red represents high concentrations ofimpervious surfaces. Blue represents moderate concentrations and greenrepresents low concentrations of impervious surfaces. The base image wasacquired by NASA's Landsat satellite, while the map of impervious surfaceswas derived with data from both Landsat and Space Imaging'shigh-resolution IKONOS satellite.
For more information, read: NewSatellite Maps Provide Planners Improved Urban Sprawl Insight
References & Resources
Image courtesy Stu Snodgrass, NASA GSFC Scientific Visualization Studio, based on data from Landsat 7 and IKONOS.
None


