


June 5, 2012
Melting Ice in Hudson Bay
When Northern Hemisphere sea ice reaches its maximum extent each winter, it also covers Hudson Bay in northeastern Canada. In summer, warm temperatures and long hours of sunlight cause ice to retreat dramatically in the Arctic Ocean; yet some persists all through the summer. Not so in Hudson Bay. Its ice starts to retreat in May, and often melts out completely sometime in July.
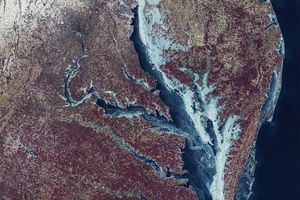
The Moderate Resolution Imaging Spectroradiometer (MODIS) on NASA’s Aqua satellite observed ice retreat in the Hudson Bay in 2012. These images show the southeastern corner of Hudson Bay on April 6 (top) and June 5 (bottom). These images have been rotated so that north is to the right.
In early April 2012, snow blankets most of the land and sea ice coats the water in the bay. The ice is not a uniform sheet of frozen material. Instead, pieces of varying sizes drift with winds and currents. Breaks in the ice allow glimpses of darker open water, some of which owe their existence to winds pushing ice away from shore.
By June 2012, snow has melted and ice has retreated, leaving Akimiski Island and the Belcher Islands easier to spot. The ice in Hudson Bay has taken on a bluish tinge, likely due to waterlogging and surface melt. Note that ice has moved into some areas where it had not appeared in early April (for instance, south and west of the Belcher Islands). The ice isn’t spreading, it’s simply moving and, when broken into small pieces, can drift easily. Unlike two months earlier, areas of open water result from melt.
Since the 1970s, the timing of sea ice breakup in Hudson Bay has changed, with melting earlier in the spring. This trend is strongest in the western part of the bay. A modeling study projected that future warming in this region could bring further changes, reducing the duration of ice-covered conditions by seven to nine weeks per year. The changes were likely to be the most pronounced in southeastern Hudson Bay and James Bay.
Link
- Sea ice Index. National Snow and Ice Data Center.
References & Resources
- Joly, S., Senneville, S., Caya, D., Saucier, F.J. (2011) Sensitivity of Hudson Bay Sea ice and ocean climate to atmospheric temperature forcing. Climate Dynamics, 36, 1835–1849.
- Scott, J.B.T., Marshall, G.J. (2010) A step-change in the date of sea-ice breakup in western Hudson Bay. Arctic, 63(2), 155–164.
NASA Earth Observatory image by Jesse Allen using data obtained from the Land Atmosphere Near real-time Capability for EOS (LANCE). Caption by Michon Scott with information from Walt Meier and Ted Scambos, National Snow and Ice Data Center.