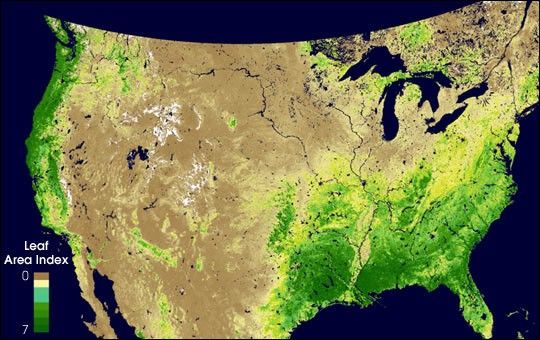

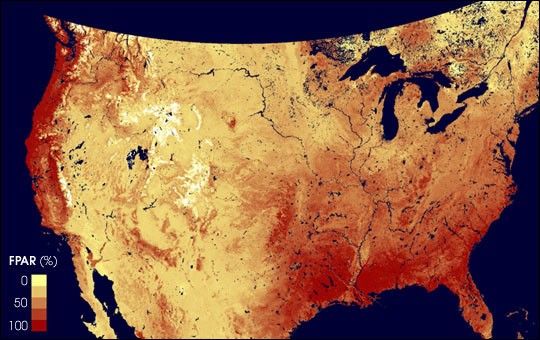
This composite image over the continental United States wasproduced with data acquired by the Moderate-resolution ImagingSpectroradiometer (MODIS) during the period March 24—April 8, 2000.The image is a map of the fraction of the photosyntheticallyavailable radiation that was absorbed by land vegetation forphotosynthesis. Notice how closely the high and low values in this imagecorresponds to yesterday's Leaf Area Index. Theseare the first two in a series of images over the continental U.S. produced by theMODIS Land Discipline Group (refer to this site on June 5 for the next image inthe series).
Today's image is a MODIS data product called "Fraction of PhotosyntheticallyActive Radiation," which is a measure of the proportion of the sunlight actuallyabsorbed by plants versus the total available energy in those wavelengths ofsunlight that a vegetation canopy can absorb. In this image, dark red pixelsshow where land plants are absorbing 100 percent of the photosyntheticallyavailable sunlight, pink pixels show where plants are absorbinganywhere from 25 to 75 percent of the sunlight, and tan pixels showzero absorption.
The more leaf area a plant has, the more sunlight it can absorb forphotosynthesis. The Fraction of Photosynthetically Active Radiation is one of anew suite of measurements that scientists use to understand how the Earth's landsurfaces are changing over time. Their goal is to use these measurements torefine computer models well enough to simulate how the land biosphere influencesthe natural cycles of water, carbon, and energy throughout the Earth system.
This image is the first of its kind from the MODIS instrument,which launched in December 1999 aboard the Terra spacecraft. MODISbegan acquiring scientific data on February 24, 2000, when it firstopened its aperture door. The MODIS instrument and Terra spacecraftare both managed by NASA's Goddard Space Flight Center, Greenbelt, MD.
References & Resources
Image courtesy Steven Running, MODIS Land Group Member, University of Montana