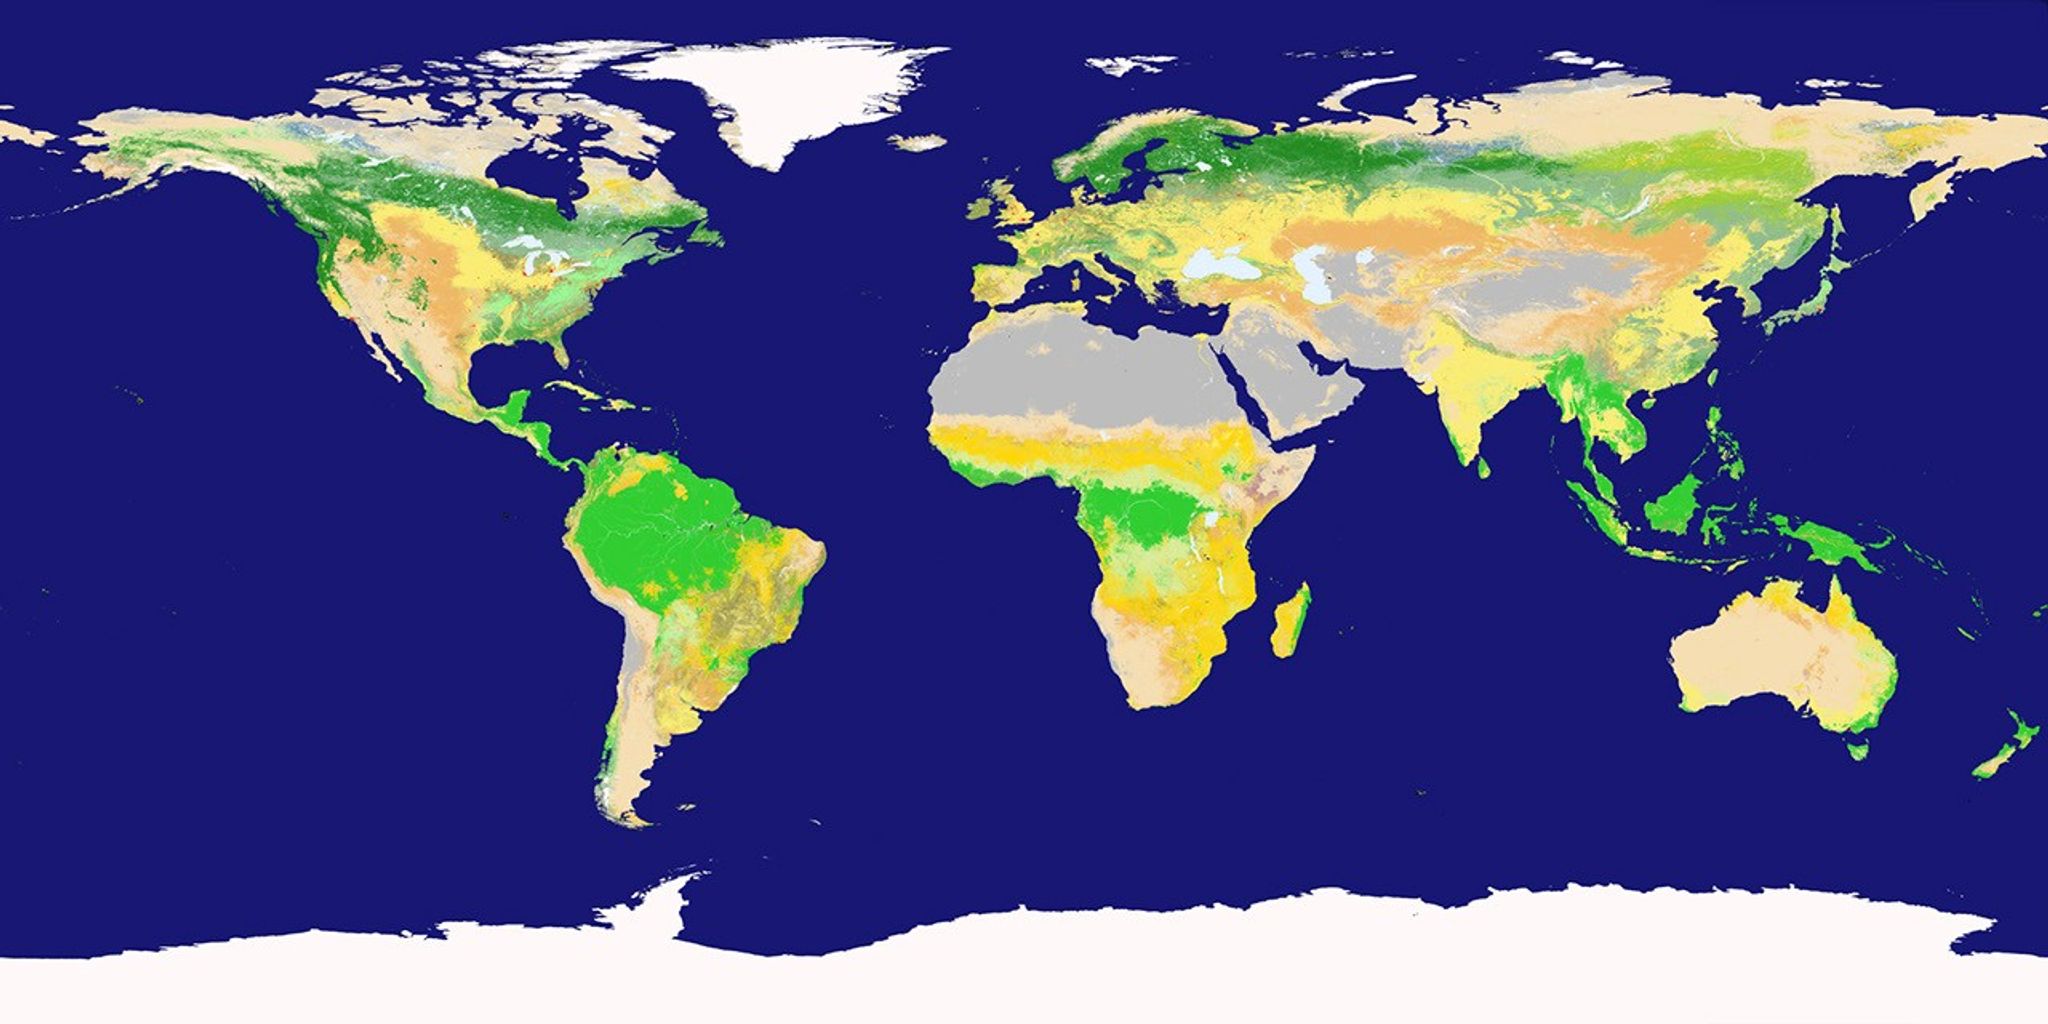


New NASA land cover maps are providing scientists with the most refinedglobal picture ever produced of the distribution of Earth’s ecosystems andland use patterns. High-quality land cover maps aid scientists and policy makersinvolved in natural resource management and a range of research and globalmonitoring objectives.
The land cover maps were developed at Boston University in Boston, MA.,using data from the Moderate Resolution Imaging Spectroradiometer (MODIS)instrument on NASA’s Terra satellite. The maps are based on a digitaldatabase of Earth images collected between November 2000 and October 2001.
“These maps, with spatial resolution of 1 kilometer (.6 mile), mark asignificant step forward in global land cover mapping by providing a clearer,more detailed picture than previously available maps,” says Mark Friedl,one of the project’s investigators.
The MODIS sensor’s vantage point of a given location on Earth changeswith each orbit of the satellite. An important breakthrough for these maps isthe merging of those multiple looks into a single image. In addition, advancesin remote sensing technology allow MODIS to collect higher-quality data thanprevious sensors. Improvements in data processing techniques have allowed theteam to automate much of the classification, reducing the time to generate mapsfrom months or years to about one week.
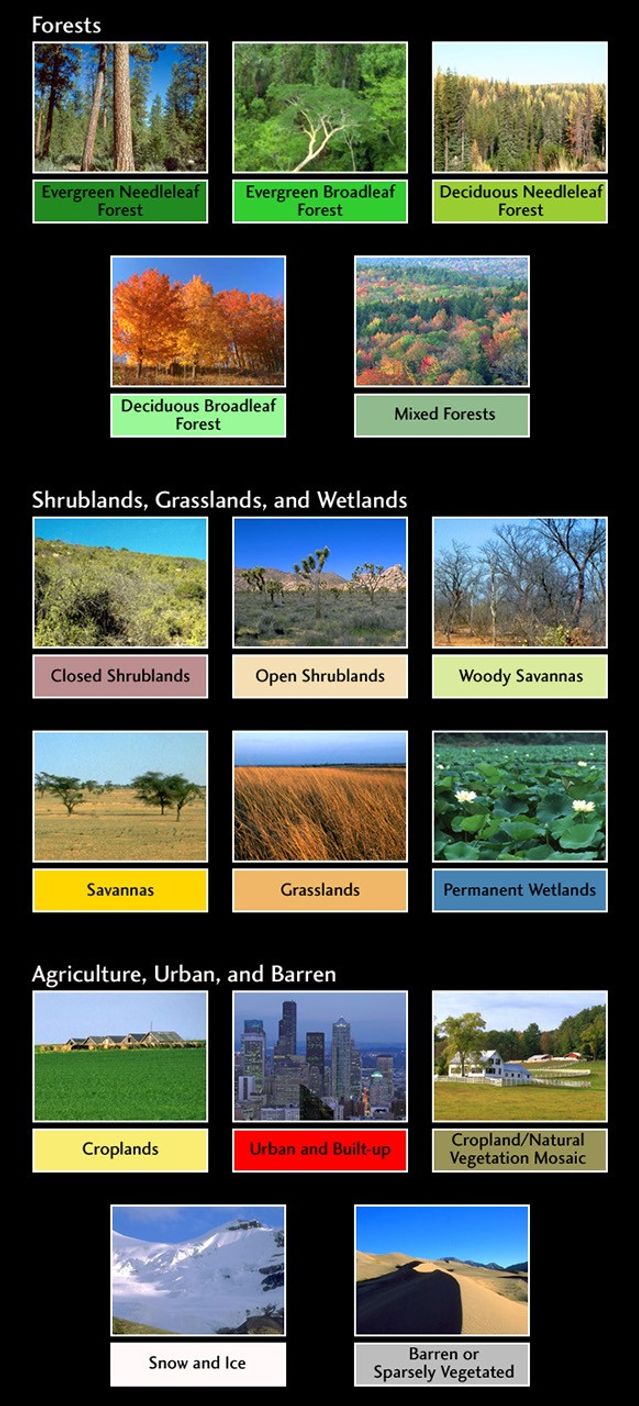
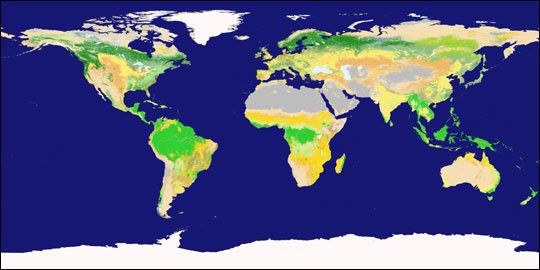
This image shows global landcover types in different colors. Each land cover has a different effect oncarbon and climate cycles. Snow and ice cool the planet by reflecting sunlight.Tropical rainforests are part of an intricate land-atmosphere relationship thatis disturbed by land cover changes such as deforestation. Perhaps the mostsignificant human alteration of land cover is the creation of large areas ofagricultural land.
For more information, images, and animations, read NASA’s Terra Satellite Refines Map of Global LandCover
References & Resources
Image courtesy Boston University and NASA GSFC