The winter of 2004-2005 saw the second highest chemical ozone destruction ever observed over the Arctic. Polar ozone is destoyed when chlorine, cold temperatures, and sunlight mix in the atmosphere 8-50 kilometers above the Earth’s surface. Since ozone shields the Earth from ultraviolet light, the high-energy light that causes sunburns and is associated with skin cancers, low ozone levels could threaten human health. Ultraviolet levels remained near normal through the winter, however, because unusual weather conditions brought ozone from the Earth’s ozone-rich mid-latitudes to the pole to fill in the gaps left by the extreme ozone depletion.
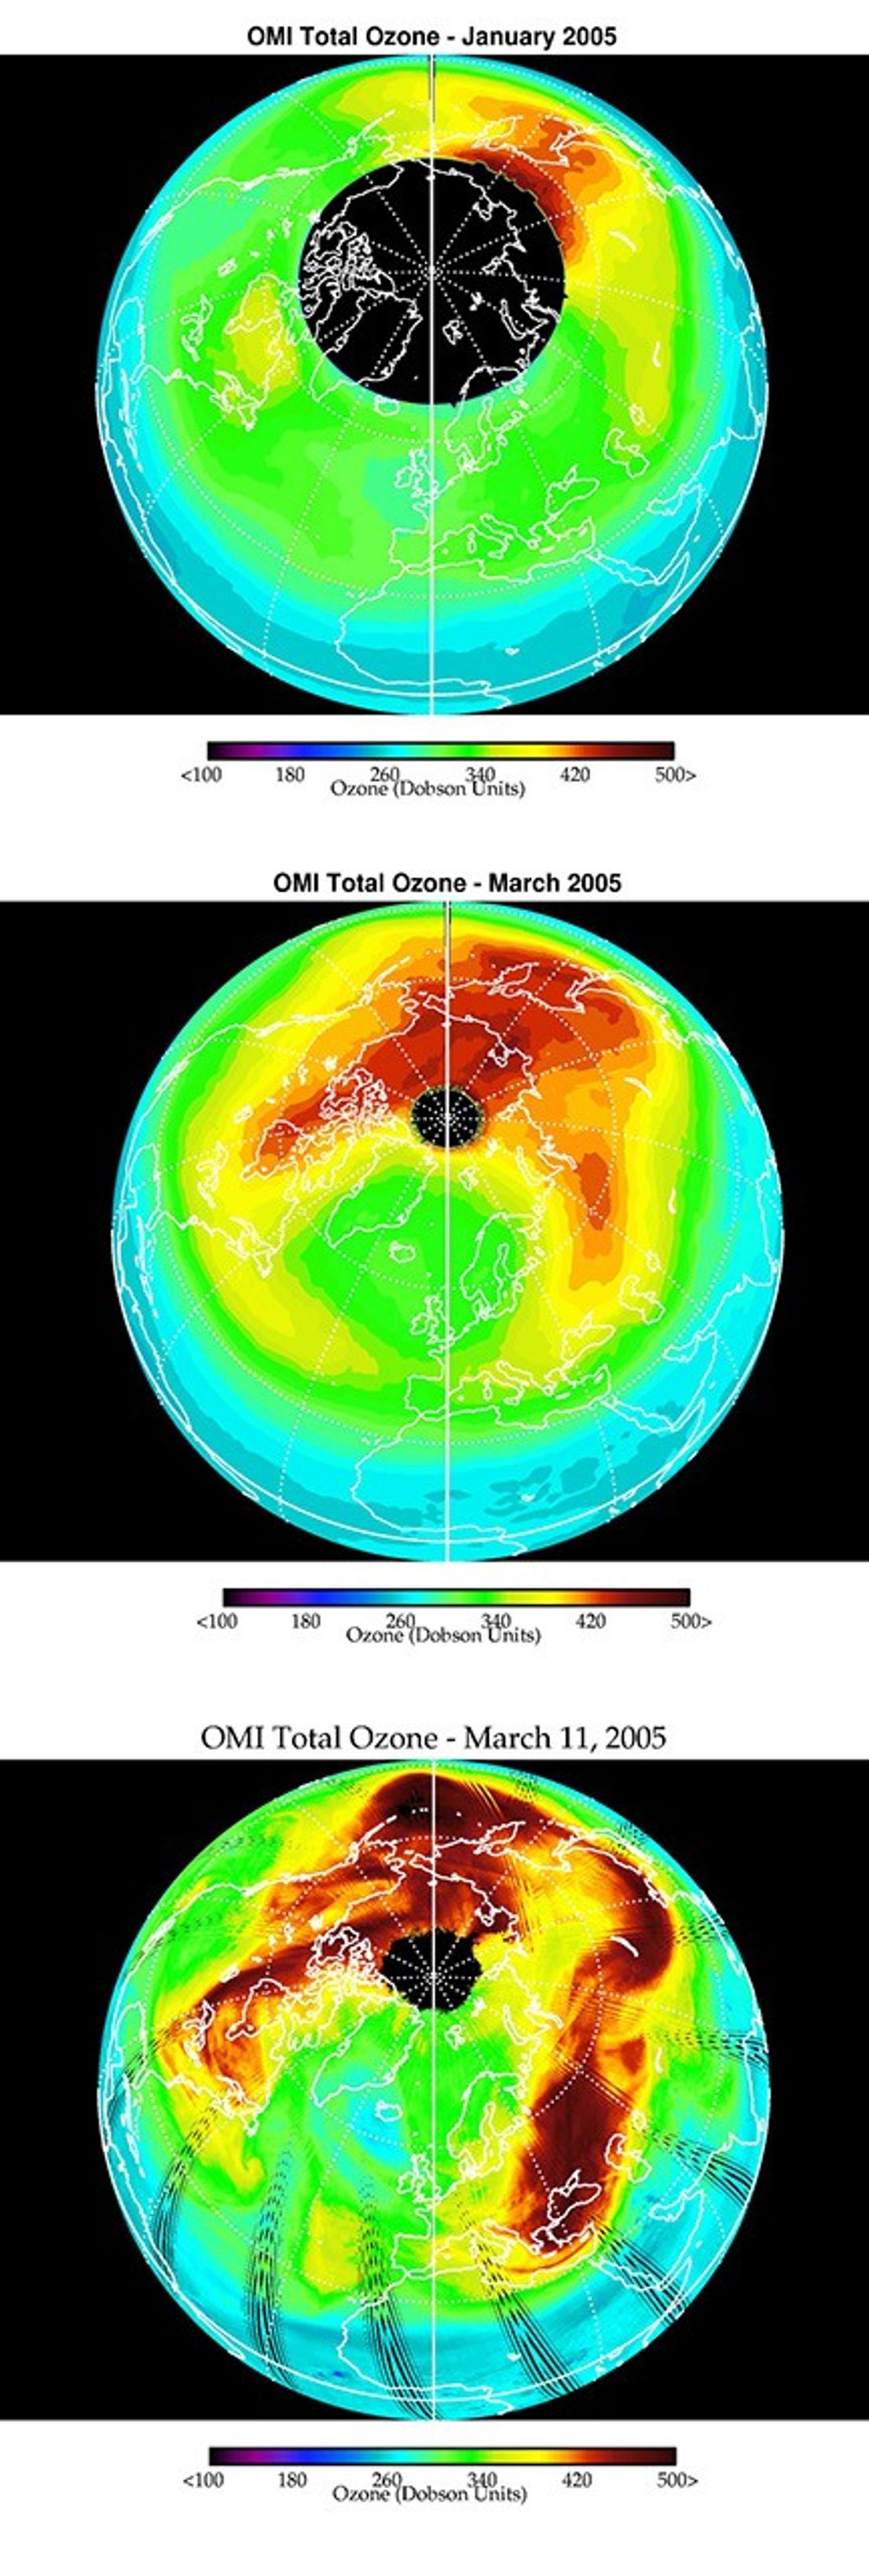
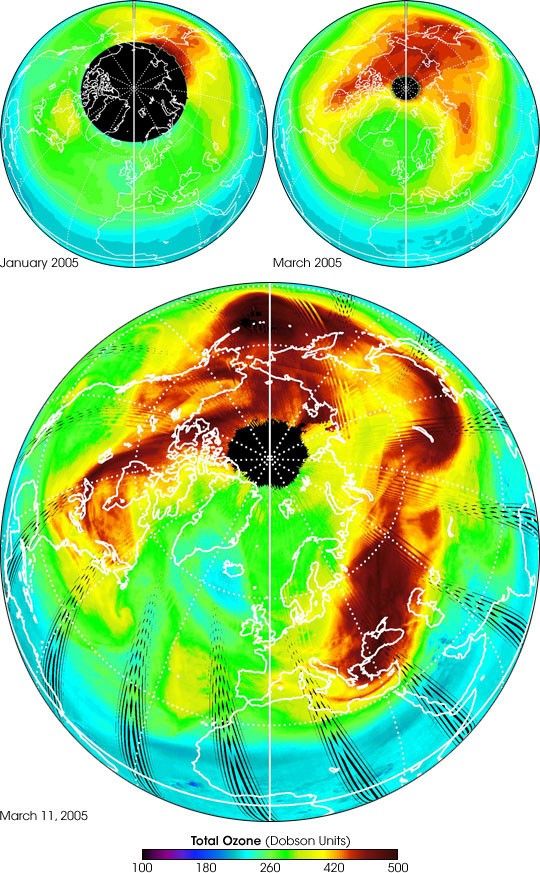
These images show the fluctuations in ozone during the Arctic winter of 2005. The top two images show the average total column ozone over the Arctic during the months of January and March, 2005, and the lower image shows total column ozone on a single day, March 11, 2005. The images are based on data collected by the Ozone Monitoring Instrument (OMI) aboard NASA’s Aura satellite.
During this time period, the Microwave Limb Sounder, another instrument on the Aura satellite, measured 50 percent ozone loss, the second-highest level ever observed behind the 60 percent loss measured in 1999-2000. Despite this, the lowest total column ozone values in polar regions are slightly higher in March than in January, on average, as evidenced by the broad splashes of red that represent high ozone levels. Stratospheric winds carried the ozone north into the Arctic, compensating for the significant chemical loss, so that no blue or purple holes representing low ozone levels appear in the March image. Black circles over the North pole show where OMI did not collect data.
On a single day, March 11, 2005, ozone was distributed far more unevenly, with dark red, almost black areas of high ozone over the Aleutian Islands, Asia, and Europe, and a pale blue thin spot over Iceland and Greenland. This reveals that even though ozone values appeared to be near normal on average throughout March, some regions experienced much lower ozone levels—and therefore, a greater exposure to UV light—on an individual day.
For more information and images, see “NASA Spacecraft Measures Unusual 2005 Arctic Ozone Conditions” on the NASA portal.
References & Resources
Image courtesy NASA/JPL/Agency for Aerospace Programs (Netherlands)/Finnish Meteorological Institute