


- JPEG format (300 KB)
Since the beginning of the satellite era in the mid-1960's, no hurricanehas ever been observed in the South Atlantic according to forecasters atthe National Hurricane Center. But on Sunday morning, March 28th, 2004,a storm struck the Brazilian coast that may have changed all of that asforecasters believe it to be the first hurricane ever recorded in thatregion of the world. The unnamed storm made landfall near the town ofTorres just south of the resort town of Laguna in the southern Brazilianstate of Santa Catarina, about 500 miles south of Rio de Janeiro. Therewere reports of winds as high as 100 kph (62 mph) in the area. So farreports indicate that 2 persons were killed by the storm with 500 homesdestroyed and 20,000 homes damaged leaving 1500 people homeless. Thesearch also goes on for 11 fisherman missing at sea after their 2 boatssank in 13-foot seas off the coast.
There is some debate, however, as to whether this storm was actually a truehurricane. Typically, strong wind shear in this part of the South Atlanticmakes conditions unfavorable for tropical storm development. However, ashas often been seen in the North Atlantic, extratropical systems that moveover warm waters can become transformed into tropical systems and take ontropical characteristics. This storm appears to have originated as anextratropical low that moved off the Brazilian coast on the 20th that thenbecame "cutoff", meaning it became separated from the the main air flow,on the 22nd of March. Sea surface temperatures were in the mid-70s (indegrees Fahrenheit), about the minimum needed for tropical storm formation.Meteorologists refer to tropical low pressure centers as warm cores becausethe air in the center of the circulation is warmer then the surroundingenvironmental air. Extratropical cyclones are typically cold core. TheBrazilian weather service believes that the storm was extratropical innature. As such a storm had thus far never been recorded in that area,there were no aircraft available to study the storm, leaving satellites todo the job of estimating its strength and structure.
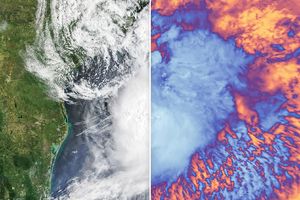
The Tropical Rainfall Measuring Mission (TRMM) satellite is designed tomeasure rainfall over the global tropics using the combination of amicrowave sensor and the first and only precipitation radar in space.TRMM was able to capture several unique images of the storm as it madeits way through the South Atlantic. The first image (top left) was taken at 12:13UTC on 24 March 2004. It shows the horizontal distribution of rain ratesas seen from above by the TRMM satellite. Rain rates in the center swathare from the TRMM Precipitation Radar (PR), while rain rates in the outerswath are from the TRMM Microwave Imager (TMI). These rain rates areoverlaid on infrared (IR) data from the TRMM Visible Infrared Scanner(VIRS). It shows a comma-shaped cloud pattern indicative of an area oflow pressure, but there is no indication of an eye and rain rates aremostly weak (blue areas) with only a few, localized areas of moderateintensity rain (green areas).
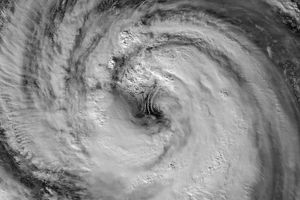
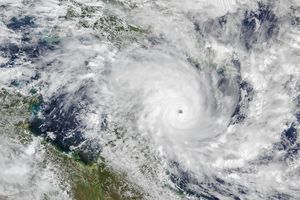
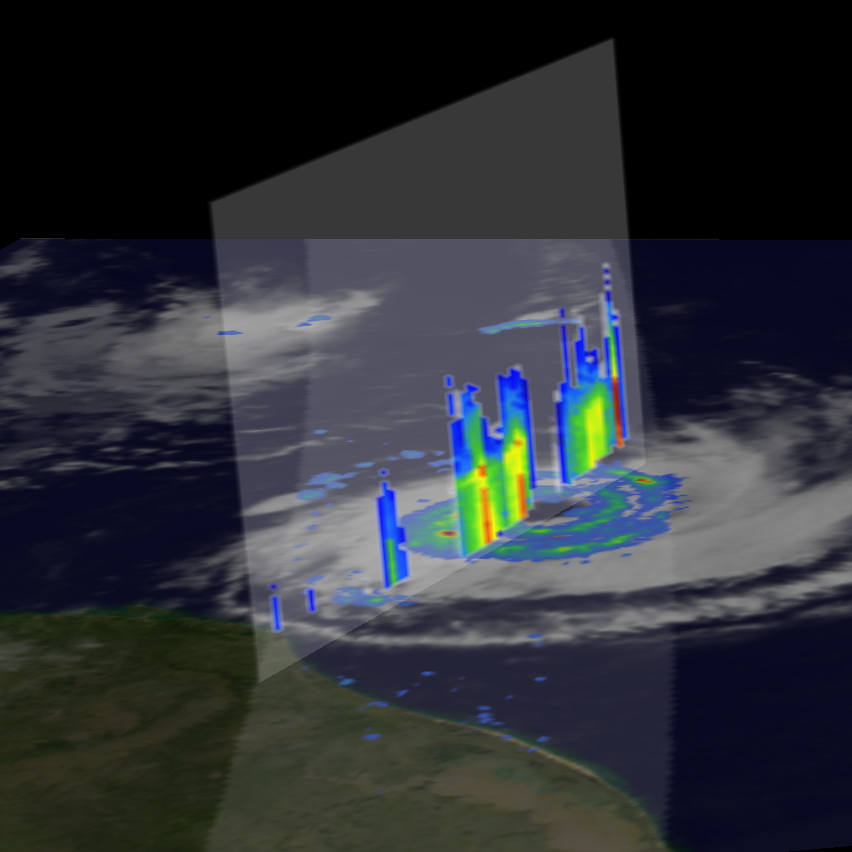
The next image (top right) taken over two days later at 12:01 UTC on the 26th showsthat the storm had become much better organized with an eye apparent inthe IR data. A long rainband continues to spiral out from the centerextending well out ahead of system as it continues to track off to thewest. The PR did not pass over the center in this image, but the TMIindicates a broad, but weak, area of rainfall south of the center. Thethird image (bottom left) was taken less than a day later at 06:11 UTC on the 27th.The storm now has a clearly defined eye in the IR data, and this timethe PR passes directly over the center revealing a nearly completeeyewall with mostly moderate intensity rain (green area) in the southernportion and well-defined spiral banding in the rainfield surrounding theeye with a couple of localized areas of heavy (red areas) rainfall. Anestimate by the AMSU (Advanced Microwave Sensor Unit) satellite put thestorm's central pressure at 979 mb, equivalent to a minimal Category 2hurricane on the Saffir-Simpson scale. The final images (bottom right and link) were taken at11:00 UTC on the 27th of March as the storm was nearing the coast ofsouthern Brazil. It now has a large, well-defined eye and a completeeyewall though rainrates in the eyewall are not particularly intense.The IR image also shows that the storm has a well-developed outflowpattern as cirrus clouds extend out to the west and south of the center.The final image shows a vertical slice through the center. It revealsmainly moderate intensity (yellow areas) rain with an embedded area ofheavy rain (red area) in the western eyewall. A single area of intenserain (darker red area) appears in an outer rainband east of the center.
For additional images, please visit the
web site.
TRMM is a joint mission between NASA and the Japanese space agency JAXA.
References & Resources
Images produced by Hal Pierce (SSAI/NASA GSFC) and caption by Steve Lang (SSAI/NASA GSFC).


