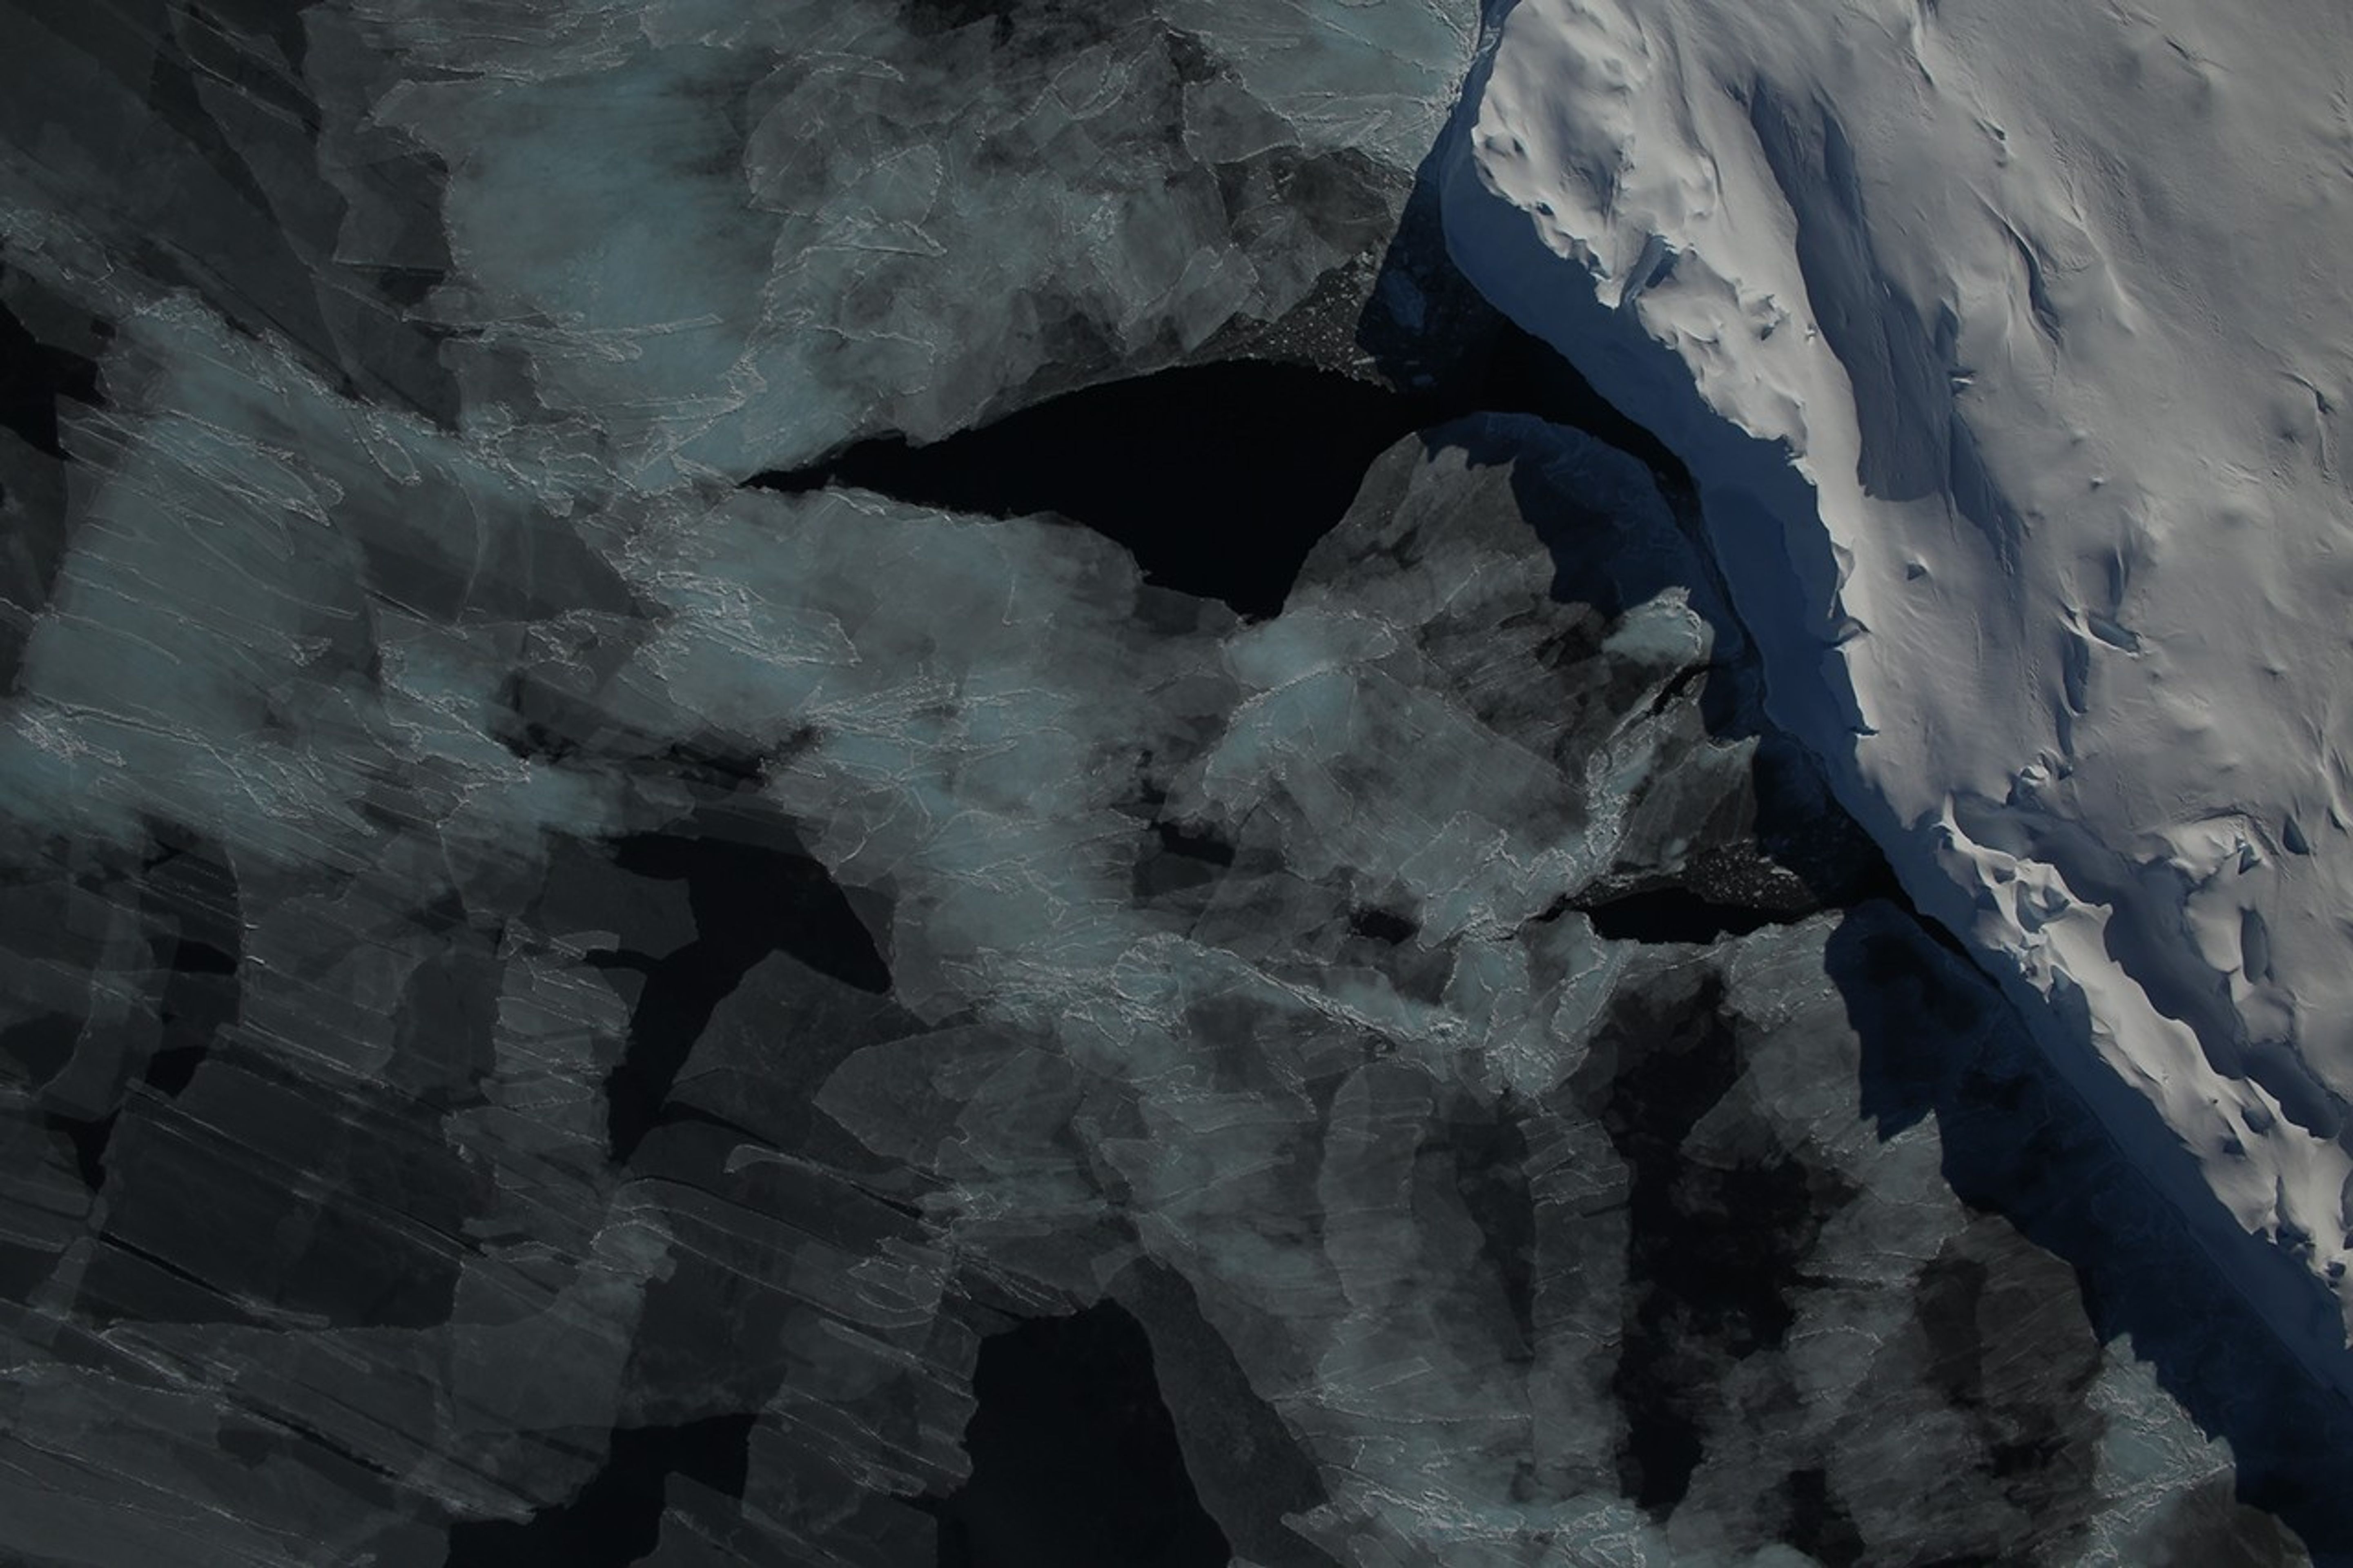


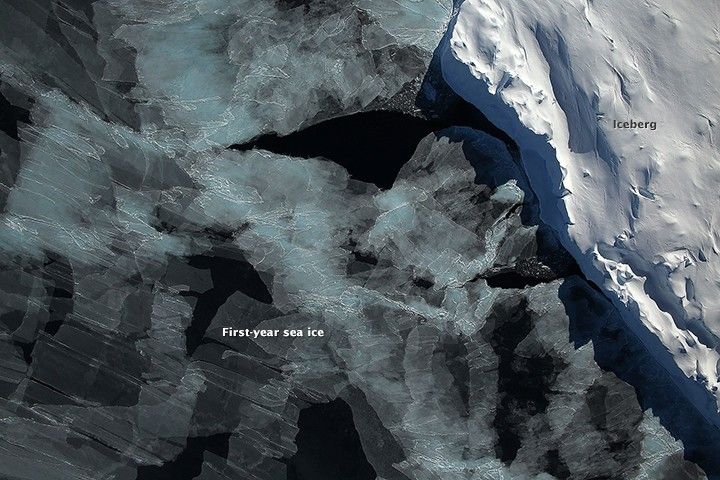
Antarctica—the continent at the southernmost reach of the planet—is fringed by cold, often frozen waters of the Southern Ocean. The extent of sea ice around the continent typically reaches a peak in September and a minimum in February. The photograph above shows Antarctic sea ice on November 5, 2014, during the annual cycle of melt.
The image was acquired by the Digital Mapping System (DMS), a digital camera installed in the belly of research aircraft to capture images of terrain below. In this case, the system flew on the DC-8 during a flight as part of NASA’s Operation IceBridge.
Most of the view shows first-year sea ice in the Bellingshausen Sea, as it appeared from an altitude of 328 meters (1,076 feet). The block of ice on the right side of the image is older, thicker, and was once attached to the Antarctic Ice Sheet. By the time this image was acquired, however, the ice had broken away to form an iceberg. Given its close proximity to the ice sheet, this could have been a relatively new berg.
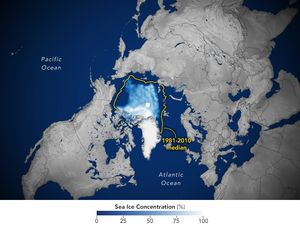
The Bellingshausen Sea is located just off the icy continent’s west side, tucked under the peninsula that reaches up toward South America. Sea ice in this sea is generally on the decline. In contrast, sea ice in the Ross Sea has seen growth, which contributed to the record high extent of sea ice around Antarctica in September 2014. But despite gains in Antarctica, research has shown that global sea ice is still decreasing.

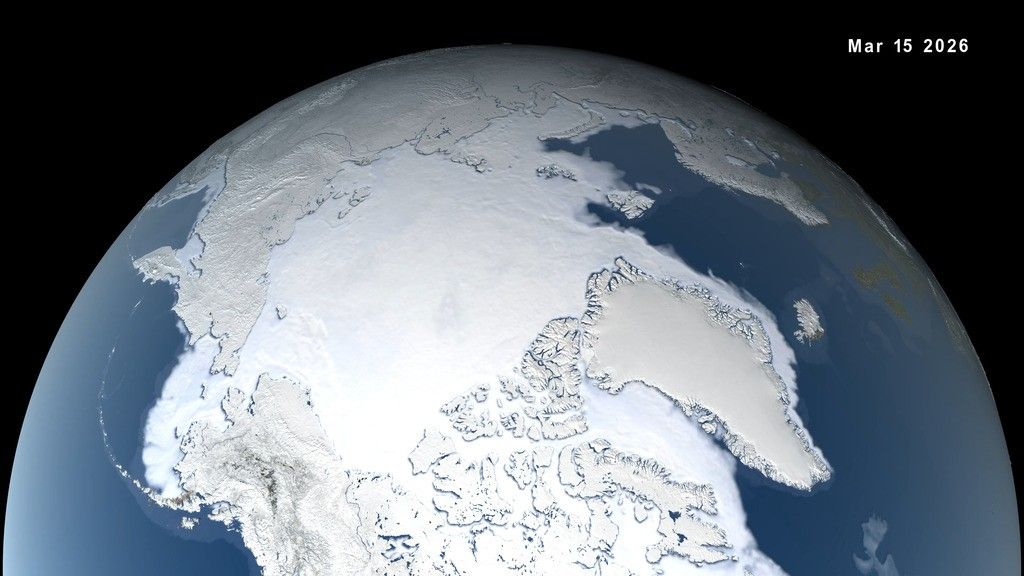
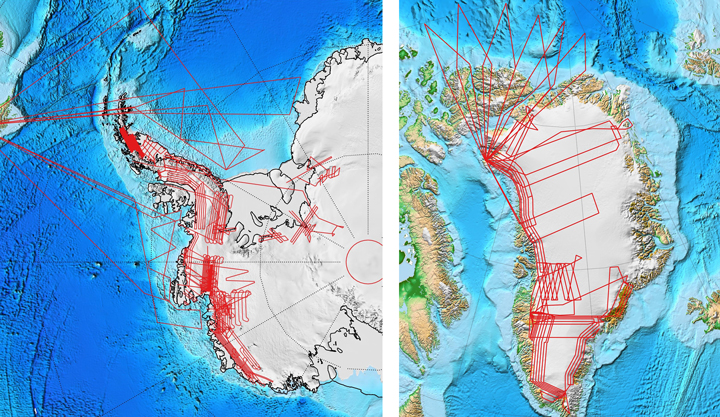
The complex behavior of sea ice around Antarctica is one reason why the IceBridge mission flies over the area every fall (spring in the Southern Hemisphere). IceBridge also surveys ice each spring over the Arctic. But in fall 2015, the mission parted with tradition and flew over both the Arctic and Antarctic simultaneously for the first time in the mission’s seven-year history. The additional measurements of sea and land ice in the Arctic are expected to provide insight into how the summer melt season continues to affect the ice.
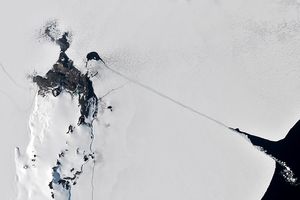
The mission’s new twist called for the addition of smaller, faster planes, such as NASA Langley Research Center’s Falcon 20. The second image above shows the Falcon 20 on the ramp at Thule Air Base in northwest Greenland on September 30, 2015. The mission’s new scope also meant planning flight lines for both the northern and southern locations. The flight plans for fall 2015 are outlined in the maps below.
References & Resources
- NASA Earth Observatory: Sea Ice (2009, April 20) Antarctic Sea Ice.
- NASA Goddard (2015, September 23) NASA to Fly Parallel Science Campaigns at Both Poles. Accessed October 2, 2015.
- NASA Goddard (2015, February 10) NASA Study Shows Global Sea Ice Diminishing Despite Antarctic Gains. Accessed October 2, 2015.
- NASA Goddard (2014, October 7) Antarctic Sea Ice Reaches New Record Maximum. Accessed October 2, 2015.
- NASA Mission Pages: IceBridge (2015, July 30) Mapping – Digital Mapping System (DMS). Accessed October 2, 2015.
IceBridge DMS L0 Raw Imagery courtesy of the Digital Mapping System (DMS) team and the NASA DAAC at the National Snow and Ice Data Center. Aircraft photograph by John Sonntag, mission scientist for the 2015 Operation IceBridge Arctic campaign. Caption by Kathryn Hansen.