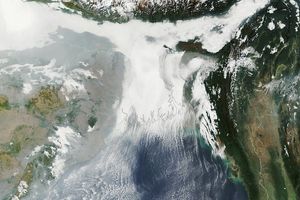


In early October 2010, a high-pressure weather system settled in over eastern China, and air pollution began to accumulate locally for nearly a week. By October 9 and 10, China’s National Environmental Monitoring Center declared air quality “poor” to “hazardous” around Beijing and in 11 eastern provinces. Citizens were advised to take measures to protect themselves, and visibility was reduced to 100 meters (330 feet) in some areas. News outlets reported that at least 32 people died in traffic accidents caused by the poor visibility. Untold were the number of people suffering with asthma and other respiratory difficulties.
On October 8, 2010, the Moderate Resolution Imaging Spectroradiometer (MODIS) on NASA’s Aqua and Terra satellites captured this natural color view of the smog event in China. The milky white and gray covering the center of the image is smog and fog, while the brighter whites at the left and right edges are clouds.
The Ozone Monitoring Instrument on NASA’s Aura satellite detected extremely high levels of aerosol particles (lower left image) and sulfur dioxide (lower right) on October 8. The sulfur dioxide typically comes from coal-burning power plants and smelters, and the peak concentrations—6 to 8 Dobson Units—were six to eight times the norm for China and 20 times the norm for the United States. The Aerosol Index indicates the presence of ultraviolet light-absorbing aerosols, most likely smoke from fires and industrial processes. At an AI value of 4, aerosols are so dense that you would have difficulty seeing the midday sun.
The event was likely caused by a blend of increased emissions—from agricultural burning, factories, and vehicle emissions—and the stagnant weather system. The relatively calm days did not bring enough wind to blow the pollution away from its sources. By October 11, a cold front brought cleansing rain and winds that cleared up the skies.
References & Resources
- Agence France Presse (via Sydney Morning Herald). (2010, October 10). 32 killed on China’s smog-hit roads. Accessed: October 13, 2010.
- China Daily. (2010, October 11) Fog blamed for China’s ‘poor’ air quality. Accessed: October 13, 2010.
- Lu, Z., Streets, D. G., Zhang, Q., Wang, S., Carmichael, G. R., Cheng, Y. F., Wei, C., Chin, M., Diehl, T., and Tan, Q. (2010). Sulfur dioxide emissions in China and sulfur trends in East Asia since 2000. Atmospheric Chemistry and Physics, 10, 6311-6331.
NASA Earth Observatory images created by Jesse Allen, using MODIS data obtained from the Goddard Level 1 and Atmospheric Archive and Distribution System (LAADS) and OMI data provided courtesy of Nickolay Krotkov, NASA/GSFC OMI Sulfur Dioxide Group. Caption by Michael Carlowicz, with interpretation from Nickolay Krotkov.