


As early as the fifth century B.C., the Chinese reported having observed dark spots on the sun. But it wasn't until 1610 that Galileo Galilei of Italy, Johannes Fabricius of Holland, Christopher Scheiner of Germany, and Thomas Harriott of England each independently made the first observations of sunspots (there is some debate over who really was the first to make the observations). All four men observed the solar blemishes through telescopes and made sketches of the sunspots changing shapes and locations. Daily observations were started at the Zurich Observatory in 1749 and, with the addition of other observatories, continuous observations were obtained starting in 1849.
What Exactly Is a Sunspot?
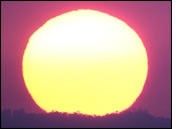
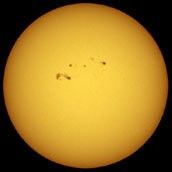
A sunspot is simply a region on the surface of the sun—called the photosphere—that is temporarily cool and dark compared to surrounding regions. Solar measurements reveal that the average surface temperature of the sun is 6000° Celsius and that sunspots are about 1500° Celsius cooler than the area surrounding them (still very hot), and can last anywhere from a few hours to a few months. Sunspots expand and contract as they move across the surface of the sun and can be as large as 80, 000 km in diameter.

Sunspots are magnetic regions on the sun with magnetic field strengths thousands of times stronger than the Earth's magnetic field, and often appear in pairs that are aligned in an east-west direction. One set will have a positive or north magnetic field while the other set will have a negative or south magnetic field. The field is strongest in the darker parts of the sunspots—called the umbra. The field is weaker and more horizontal in the lighter part—the penumbra. Overall, sunspots have a magnetic field that is about 1000 times stronger than the surrounding photosphere.
Sometimes the sun contains a large number of sunspots, while at other times, few or none are seen. In 1843, the German chemist and amateur astronomer Heinrich Schwabe discovered that there was a fairly regular cycle of change in the number of sunspots and that this cycle lasts about 11 years. The part of the solar cycle with low sunspot activity is referred to as "solar minimum" while the portion of the cycle with high activity is known as "solar maximum" or "solar max."
Today, the "sunspot number" is calculated by first counting the number of sunspot groups and then the number of individual sunspots. The sunspot number is then given by the sum of the number of individual sunspots (s) and ten times the number of groups (k), using the formula R=k(10g+s), where k is a variable scaling factor (usually < 1) that indicates the combined effects of observing conditions, telescope, and bias of the solar observers. Since most sunspot groups have, on average, about ten spots, this formula for counting sunspots gives reliable numbers even when the observing conditions are less than ideal and small spots are hard to see.
The Butterfly Diagram
Detailed observations of sunspots have been obtained by the Royal Greenwich Observatory since 1874. These observations include information on the sizes and positions of sunspots as well as their numbers. These data show that sunspots do not appear at random over the surface of the sun but are concentrated in two latitude bands on either side of the equator. A butterfly diagram (appropriately named because of its appearance) highlighting the positions of the spots for each rotation of the sun since May 1874 shows that these bands first form at the sun's mid-latitudes, widen, and then move toward the equator as each cycle progresses. By the time the sunspots reach the equator, the cycle is at a minimum, and new spots are beginning to form again at the mid-latitudes.
The Solar Wind
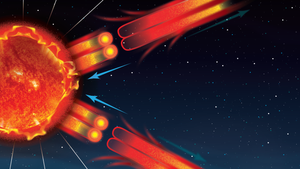
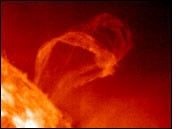
During the course of the solar cycle, tremendous explosions occur on the surface of the sun. Called solar flares, these colossal flareups can last from a few minutes to a few hours and can release as much energy as a billion tons of dynamite! Solar flares occur near sunspots, usually along the dividing line between areas of oppositely directed magnetic fields. The largest flares usually occur during the years preceding and following the "solar max."
Solar flares are directly responsible for disruptions of Earthly radio transmissions. As the energy from the solar flares races away from the sun—called the solar wind—some of the high-energy particles are able to penetrate a layer of Earth's atmosphere called the ionosphere (the ionosphere plays a part in radio transmission because it reflects radio waves back down to the surface of the Earth). When the ionosphere is disrupted by the solar wind, static radio reception or even a complete loss of signal can be experienced.
In addition, the solar wind can affect power grids and Earth-orbiting satellites. In 1989, a power blackout in the American northeast and Canada was triggered by a geomagnetic storm that overloaded one part of the power grid and caused a blackout to cascade through the system. Several satellites have been disrupted as high-energy particles associated with the solar wind flowed through sections of the satellites and damaged their sensitive electronics. In 1979, the Skylab space station prematurely re-entered Earth's atmosphere due to a malfunction caused by increased solar activity, and consequently rained debris over the Indian Ocean and parts of western Australia.
For these reasons, operators of satellites, power systems, pipelines, and other sensitive systems keep an eye on solar-terrestrial activities by way of the Space Environment Center in Boulder, Colorado. The center, in turn, collects data from ground and orbiting solar telescopes, magnetometers, and other instruments, and posts warnings on the Internet and through direct contact.
References
- Kuhn, Karl F., 1994: In Quest Of The Universe, West Publishing Company, St. Paul, 568 pp.
NASA Earth Observatory story by Steve Graham