


![Request for Information – Potential [Placeholder for Prize]](https://assets.science.nasa.gov/dynamicimage/assets/science/psd/solar/2023/09/s/solarsystem_0.jpg?w=1024)


- June 20 (560 KB)
- Rainfall Accumulation (380 KB)
- Quicktime (.mov) format (400 KB)
- MPEG-1 (.mpg) format (760 KB)
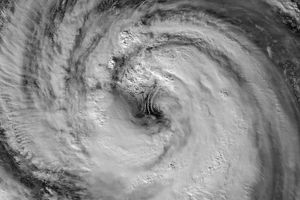
At one time Dianmu was a very powerful super typhoon packing winds of 155knots (178 mph) over the central Philippine Sea back on the 16th and 17thof June 2004. As forecast, Dianmu weakened significantly as as itapproached the main islands of Japan. Dianmu made landfall near the cityof Muroto on the island of Shikoku in southern Japan early on the morningof the 21st of June 2004 (local time) as a minimal typhoon. The center ofDianmu passed over the center of the main Japanese island of Honshu beforeemerging into the Sea of Japan. The system continued to weaken and rapidlyaccelerate northward crossing over the northern Japanese island of Hokkaidobefore heading out into the north Pacific. The storm was responsible for 3 deaths and 3 missing in Japan.
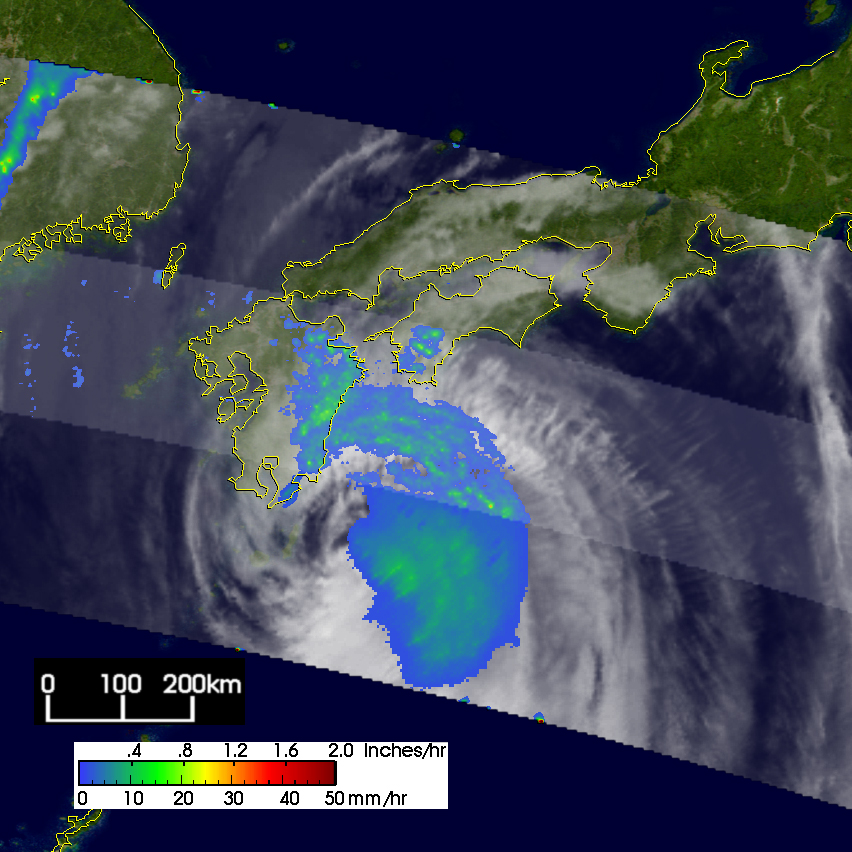
The Tropical Rainfall Measuring Mission (TRMM) satellite continued to monitorDianmu as it approached Japan. The first image was taken at 11:08 UTC on 19June 2004 and shows the horizontal distribution of rain intensity. Rainrates in the center swath are from the TRMM Precipitation Radar (PR), whilerain rates in the outer swath are from the TRMM Microwave Imager (TMI).The rain rates are overlaid on infrared (IR) data from the TRMM VisibleInfrared Scanner (VIRS). At the time of this image, Dianmu was east of thecentral Ryukyu Islands and still a strong storm with winds estimated at 105knots (121 mph) by the Joint Typhoon Warning Center soon after this imagewas taken. However, Dianmu was already in the process of rapidly weakening.TRMM shows Dianmu has a rather large eye with very little rain surroundingthe center (blue areas represent light rain). Tropical cyclones are likelarge heat engines and require strong heating near their core to maintaintheir circulation. Rainfall provides a measure of that heating, and sowithout it, Dianmu can only continue to spin down and weaken.
The next image was taken at 15:07 UTC on the 20th and shows the storm hasbecome less organized and weaker as it nears Japan with almost no evidenceof an eye visible in the rain field. A broad area of light to moderaterain (blue and green areas) wraps around the eastern and northern part ofthe storm. At this time, the maximum sustained winds were down to 70 knots(81 mph).
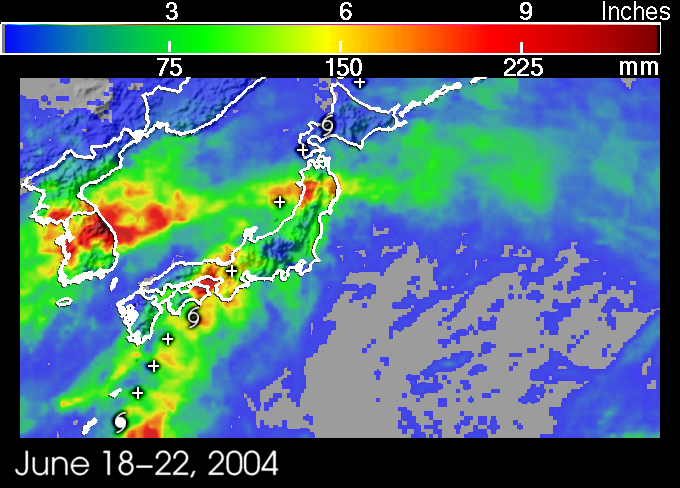
The TRMM-based, near-real time Multi- satellite Precipitation Analysis (MPA)at the NASA Goddard Space Flight Center provides quantitative rainfallestimates over the global tropics. The final image shows MPA rainfalltotals for the period 18-22 June 2004. Dianmu's track is marked by cyclonesymbols at the 00:00 UTC times and crosses every 6 hours in between. Theheaviest rainfall totals associated with Dianmu are on the order of 10inches (red areas) and occur near where the storm made its initial landfallin southern Japan. Amounts from Dianmu are not excessive as the storm wasmoving rather quickly. The area of heavy rain that extends from the Koreanpeninsula across the Sea of Japan and merges with the rain from Dianmuover northern Honshu is associated with a seasonal frontal system and isnot directly due to the typhoon.
TRMM is a joint mission between NASA and the Japanese space agency JAXA.
References & Resources
Images produced by Hal Pierce (SSAI/NASA GSFC) and caption by Steve Lang (SSAI/NASA GSFC), NASA's Tropical Rainfall Measuring Mission.


