






















September 11, 2003
animations:
animation (4 MB MPEG)
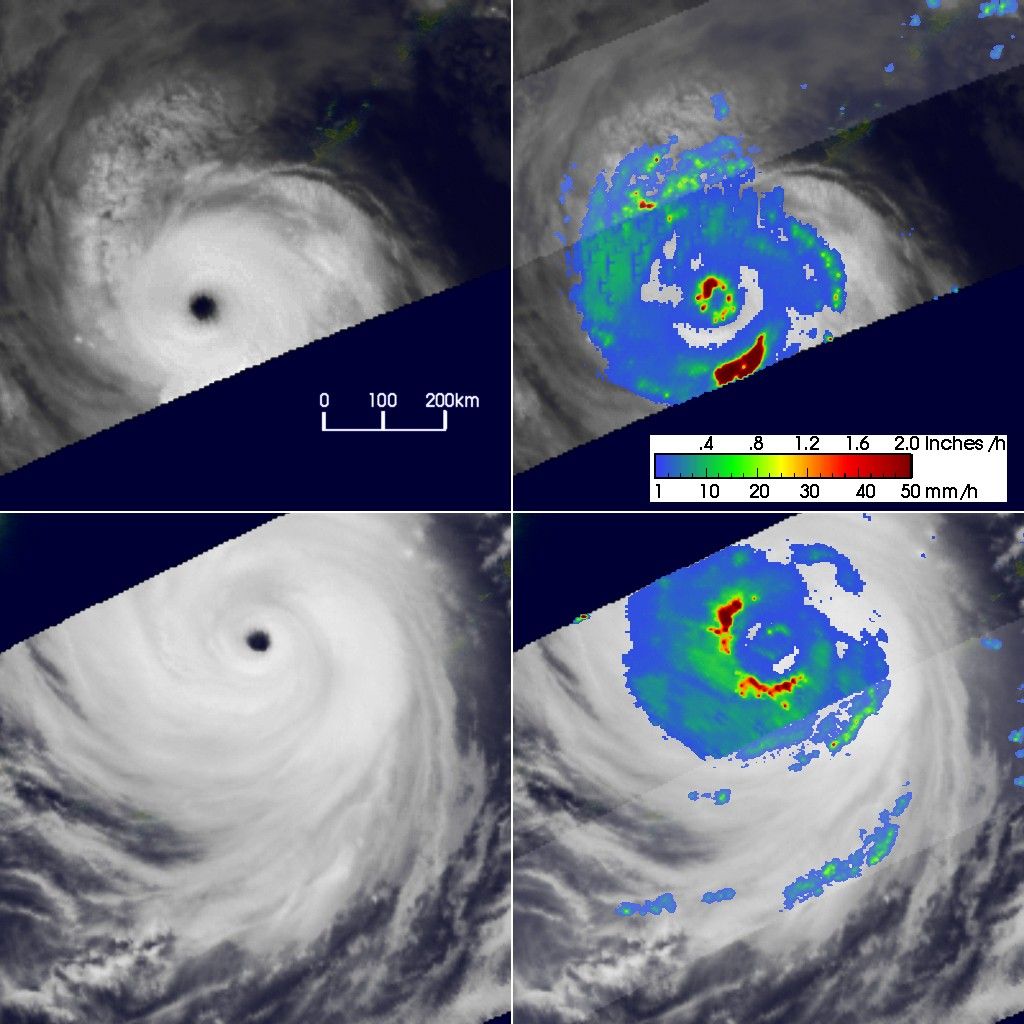
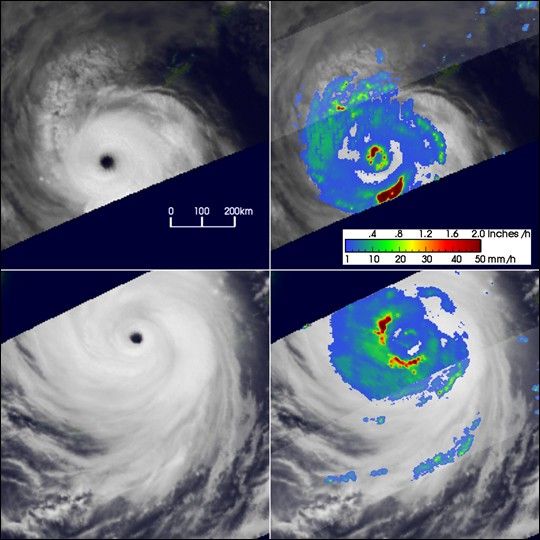
As Typhoon Maemi was churning in the waters of the East China Sea, the TRMM satellite captured this image. The accompanying visualization zooms down to the storm and peels away the clouds to reveal the underlying rain structure. Yellow areas represent areas where rain is falling at a rate of 0.5 inches per hour, greens represent areas where rain is falling at a rate of 1 inch per hour while the red areas are indicative of rain rates of 2 inches per hour.
References & Resources
Images and animations courtesy NASA/Goddard Space Flight Center Scientific Visualization Studio.