


Pioneering climate scientist Charles David Keeling died Monday, June 20, 2005. Keeling was best known for his precise measurements of atmospheric carbon dioxide, charted above in the Keeling curve, one of the most recognizable images in modern science.
The measurements show the steady rise of carbon dioxide levels in the atmosphere over a forty-seven-year period (1958-2005). Regular wobbles reflect the inhalation and exhalation of the Earth as plants grow, absorbing carbon in the summer and spring, and decay, releasing carbon in the fall and winter. The measurements shown in this curve represent the world’s longest continuous record of atmospheric carbon dioxide and were the first to confirm the rise of atmospheric carbon dioxide released from the burning of fossil fuels. As such, this is considered to be among the most important time-series data sets for the study of global climate change.
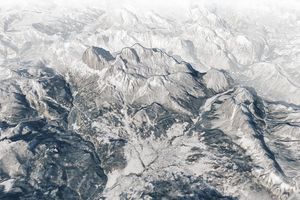
The data were collected at the Mauna Loa Observatory, perched 3,397 meters (11,140 feet) above sea level on the northern slopes of Earth’s largest volcano, away from dense vegetation or human population that might skew the measurements. The bare volcanic landscape surrounding the observatory is shown in the photo inset.
In a June 22 press release from the Scripps Institution of Oceanography—the organization that funded Keeling’s work and with which Keeling had been affiliated since 1956—the current director, Charles F. Kennel, praised Keeling’s research with the following words: “Charles David Keeling’s measurements of the global accumulation of carbon dioxide in the atmosphere set the stage for today’s profound concerns about climate change. They are the single most important environmental data set taken in the 20th century. David Keeling was living proof that a scientist could, by sticking close to his bench, change the world.”
Keeling received the National Medal of Science, the United States’ highest award for lifetime achievement in scientific research, the Tyler Prize for Environmental Achievement, and many other awards for his work. To read more about his life and research, see “Climate Science Pioneer: Charles David Keeling” on the Scripps Institution of Oceanography web site.
References & Resources
NASA graph by Robert Simmon, based on data provided by the NOAA Climate Monitoring and Diagnostics Laboratory