


- Quicktime (.mov) format (476 KB)
- MPEG-1 (.mpg) format (1.2 MB)
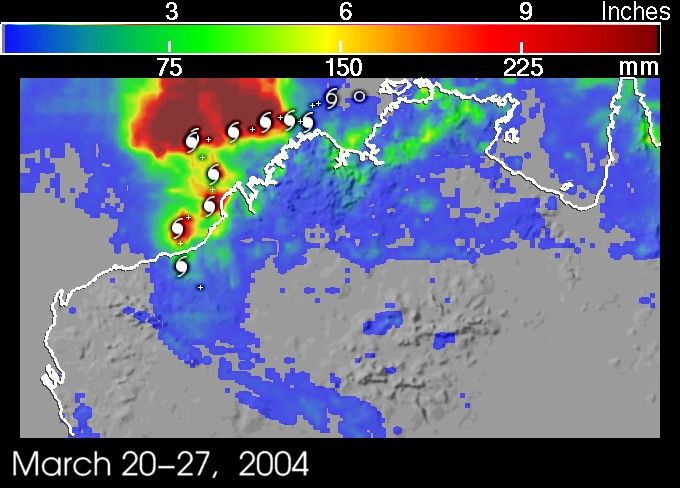
After meandering off the coast of western Australia, Cyclone Fay finallycame ashore back on the 27th of March 2004 as a powerful Category 4 cyclonewith maximum sustained winds estimated at 115 knots (132 mph). The cyclonequickly weakened over land. The Tropical Rainfall Measuring Mission (TRMM)satellite captured several unique images of Fay along its path (please, seethe previous TRMM story on Cyclone Fay).
The TRMM-based, near-real time Multi-satellite Precipitation Analysis(MPA) at the NASA Goddard Space Flight Center monitors rainfall overthe global tropics. MPA rainfall totals are shown for western Australiaand the eastern Indian Ocean in association with the passage of Fay forthe period 20 to 27 March 2004. The heaviest rainfall totals are by farand away located over the eastern Indian Ocean. The darker red areasshow rainfall totals due to Fay on the order of 12 inches in this region.The heaviest totals appear to the right of the storm track (shown by thewhite storm symbols plotted every 06Z). These heavy amounts are the productof an intense rain band located well to the north west of the center thatwas observed by TRMM starting back on the 19th of March. The highest totalsover land appear right along the coast and are on the order of 3 to 5 inches(green areas). A swath of 1 to 2 inch amounts (blue areas) extends inlandover Western Australia.
TRMM is a joint mission between NASA and the Japanese space agency JAXA.
References & Resources
Image produced by Hal Pierce (SSAI/NASA GSFC) and caption by Steve Lang (SSAI/NASA GSFC).