


- March 1, 2005 (2.12 Mb)
- March 2, 2005 (1.53 Mb)
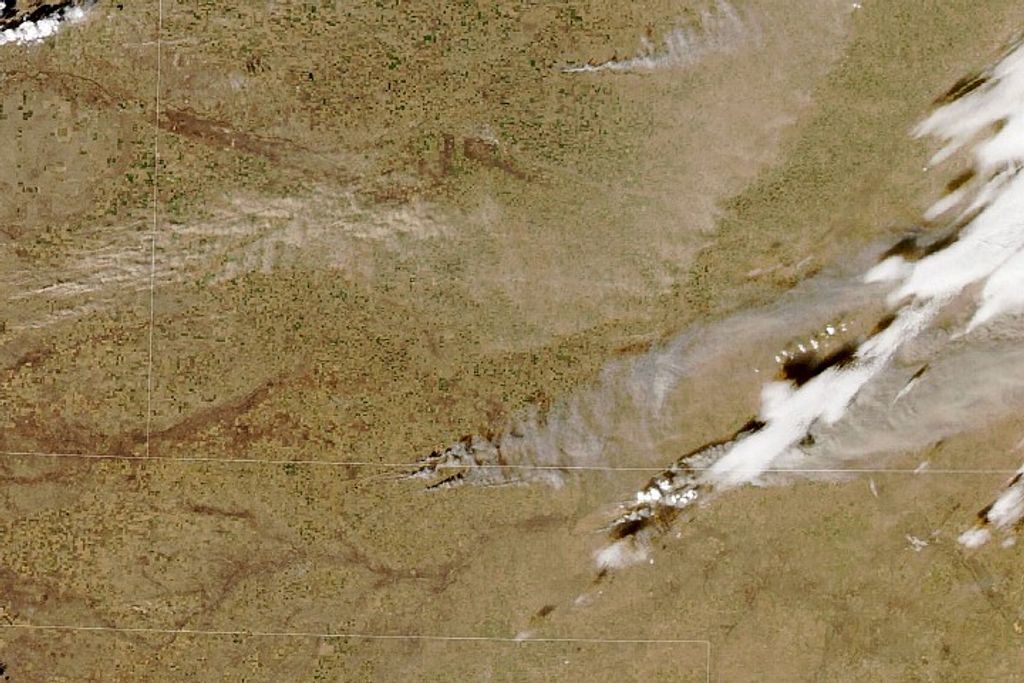
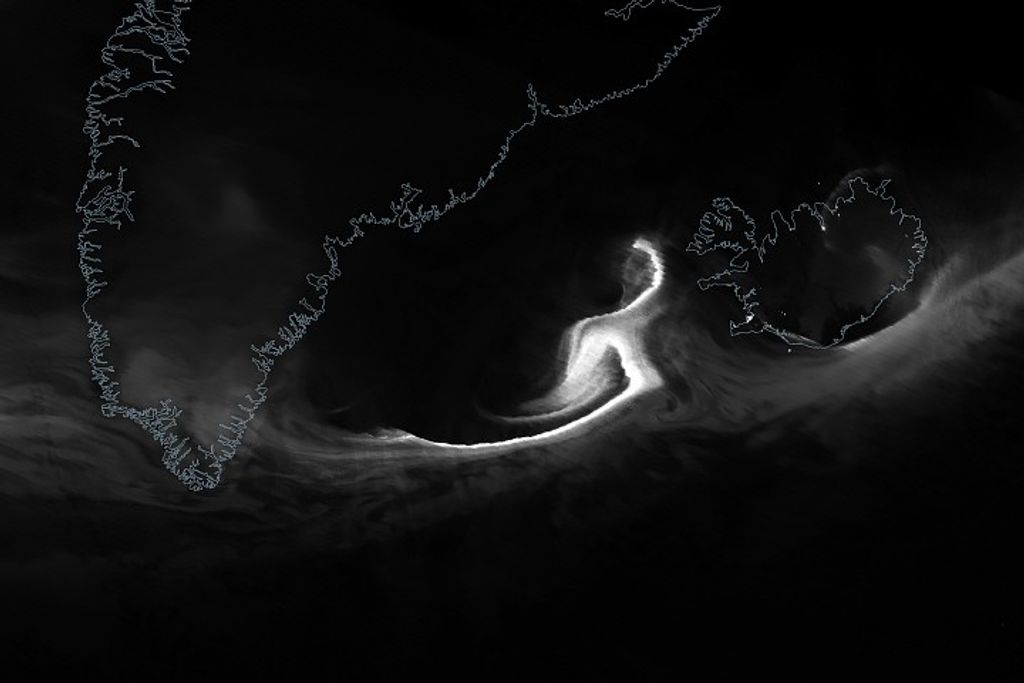
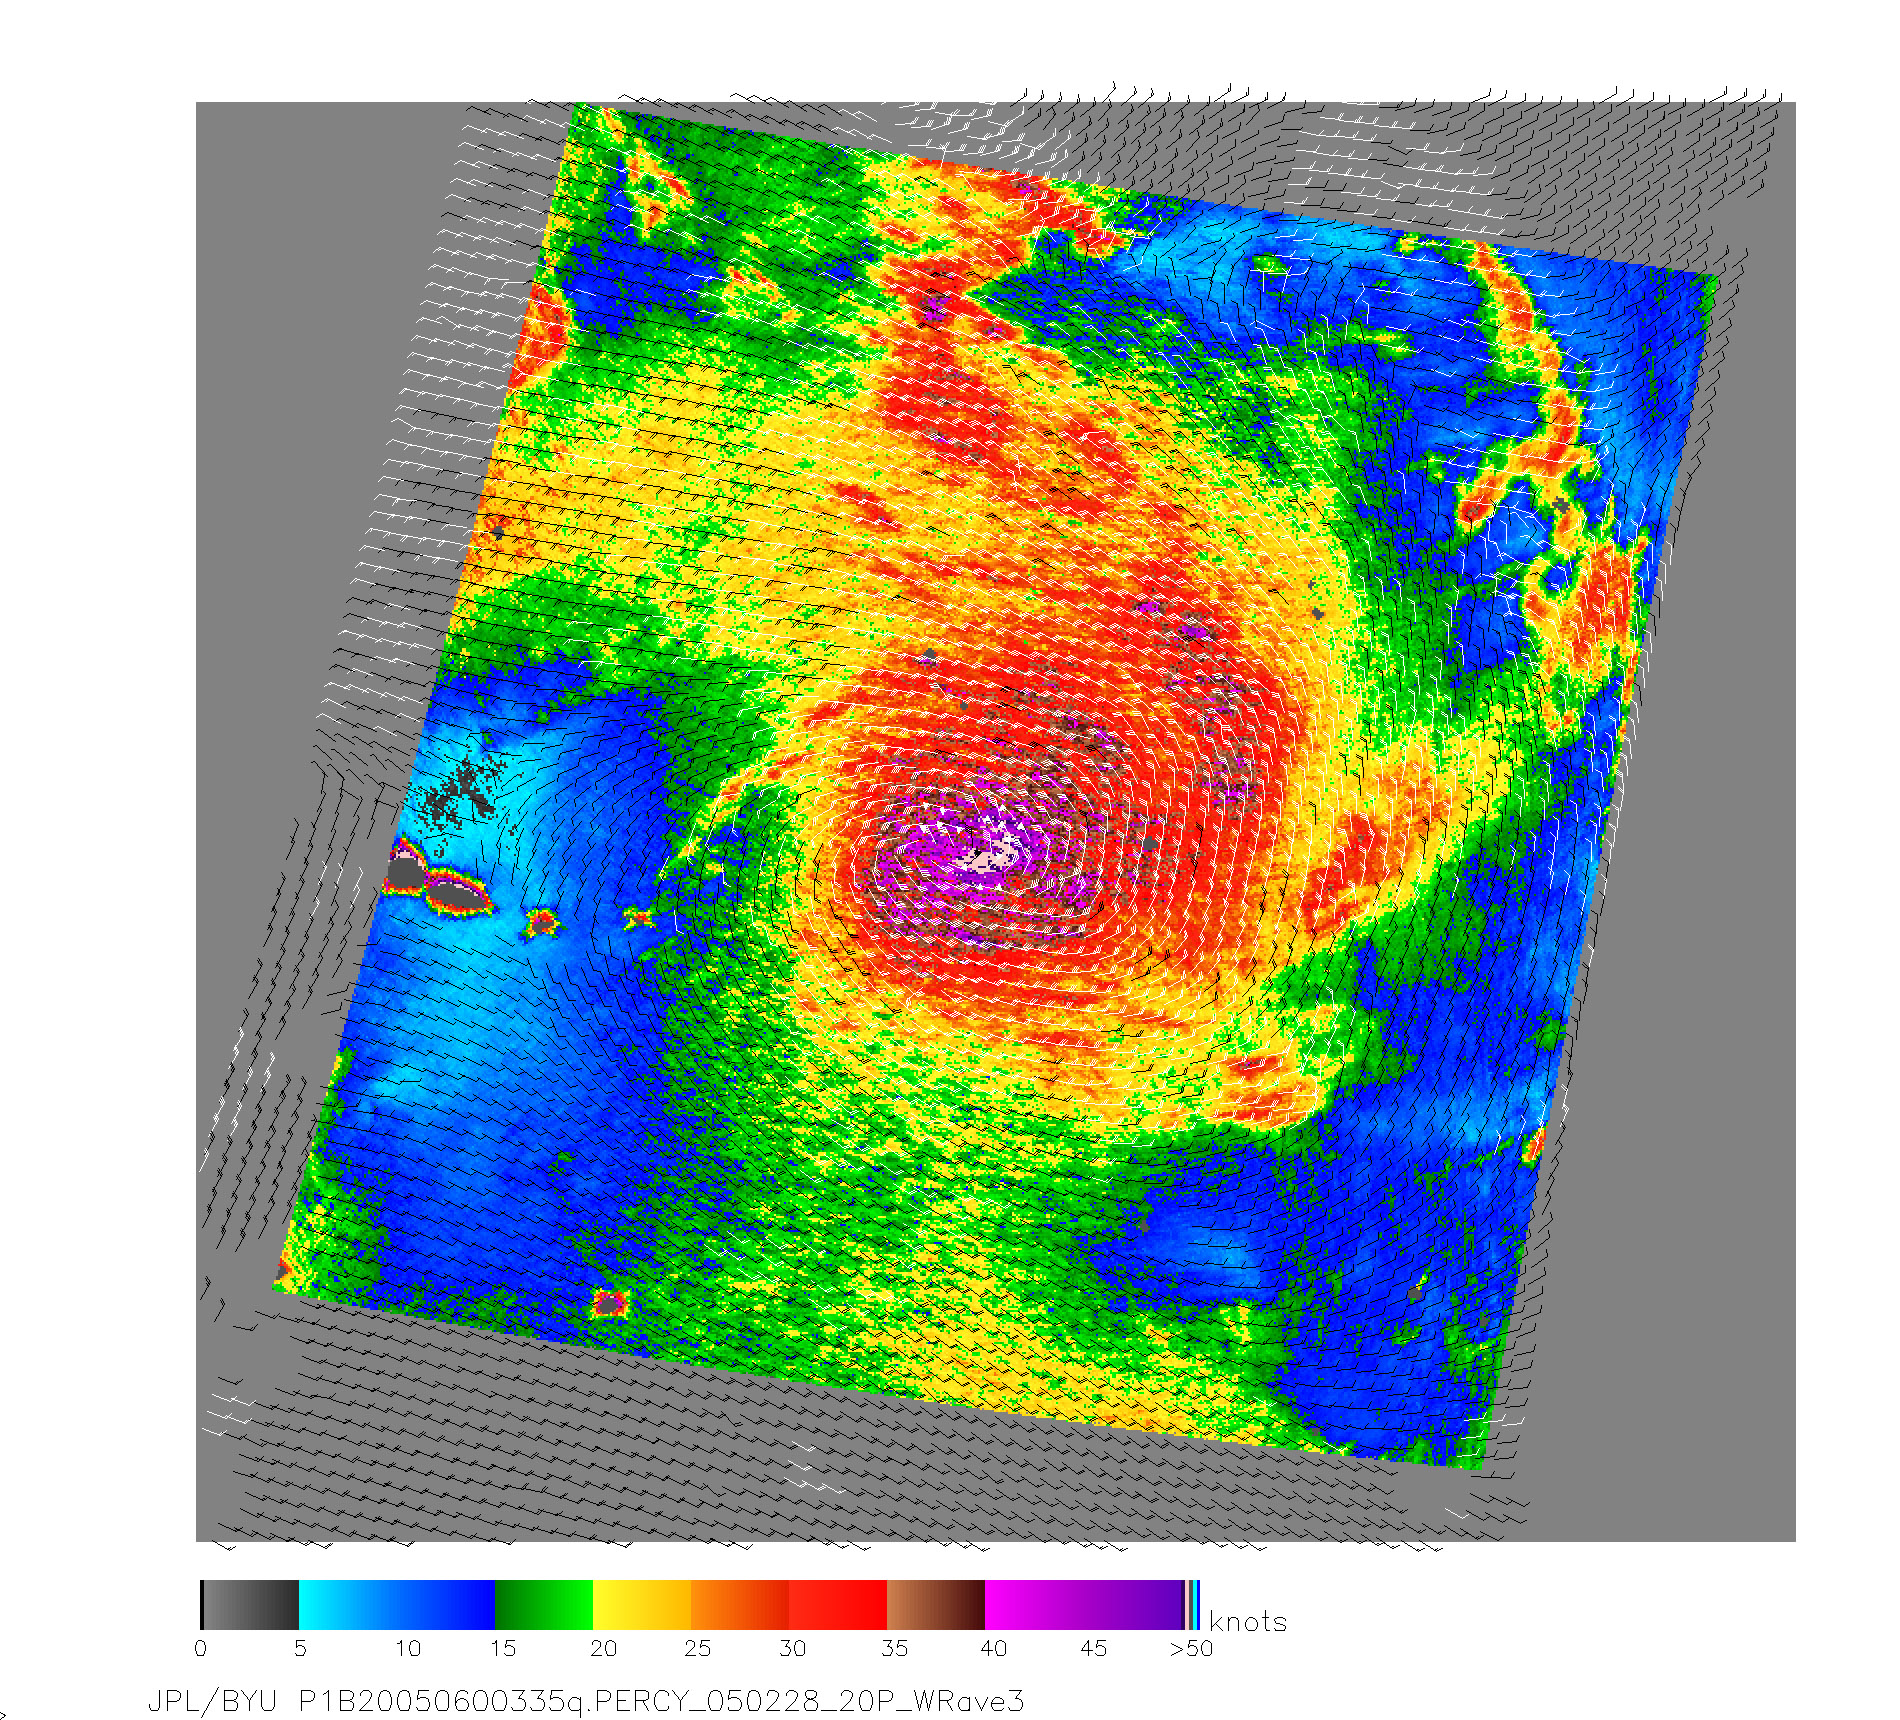
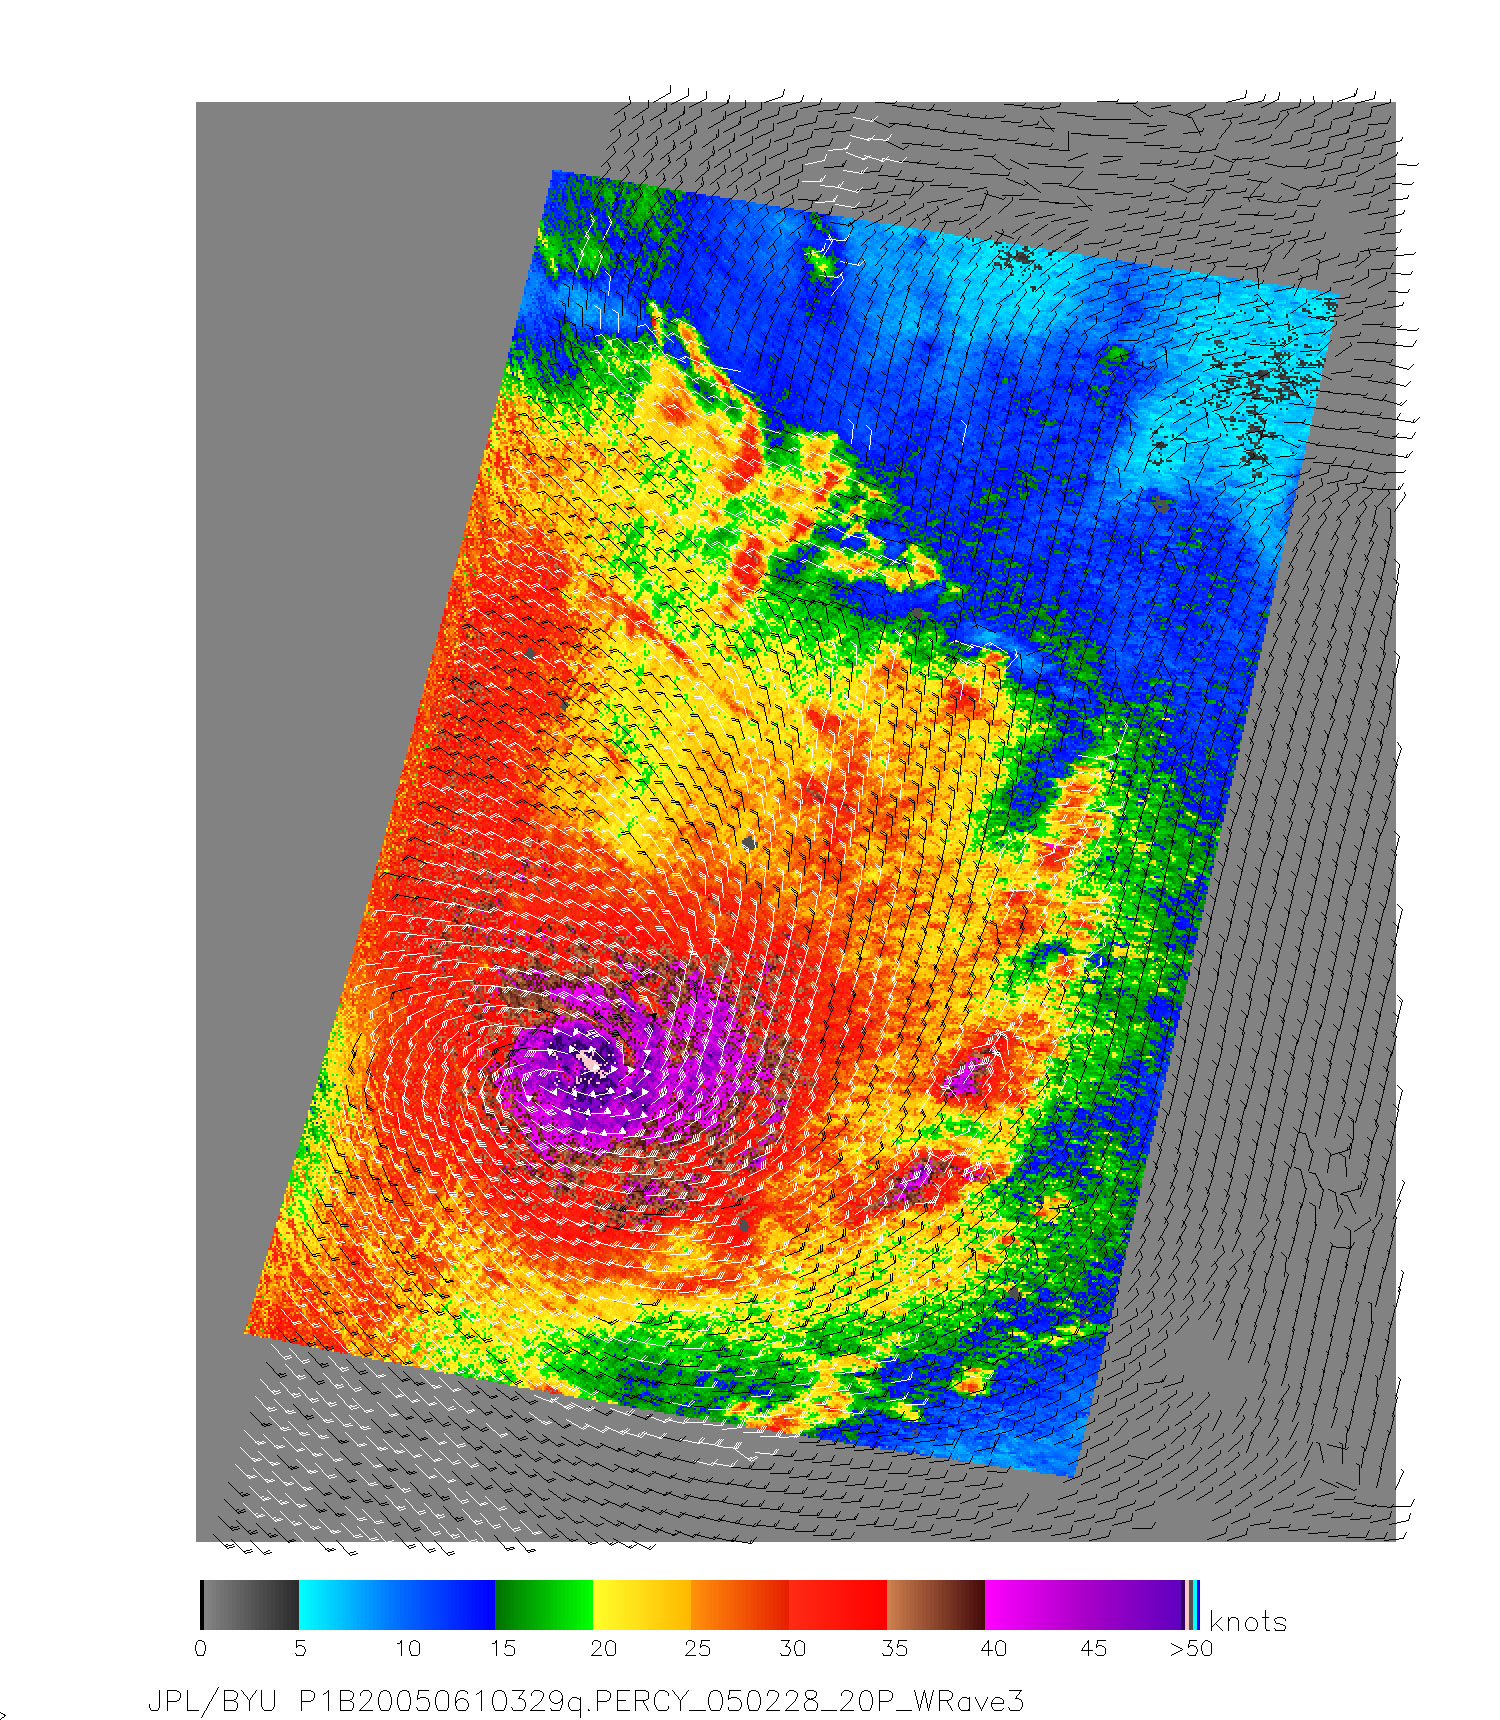
Already a powerful Pacific cyclone, Cyclone Percy exploded from a Category 4 storm to a Category 5 cyclone on March 2, 2005. NASA’s QuickSCAT satellite captured the change in the above images, taken on March 1 and March 2. The images depict wind speed in color and wind direction with small barbs. The top image shows Percy early on March 1, as the storm was strengthening from a Category 3 storm to a Category 4 storm. The highest wind speeds, shown in purple, are scattered around the center of the storm. By early the next day (lower image), the strongest winds were well-organized around the eye of the storm, resembling a “mini-cyclone.” As indicated by the darker shade of purple, the winds are also stronger than they were the previous day. Winds had strengthened around the outer edges of the storm as well. On March 2, high winds represented in red extend further out from the center of the storm, and the lower wind speeds shown in green and yellow cover a smaller area.
When the lower image was taken on March 2, Percy was a Category 5 storm, with sustained winds of 260 kilometers per hour (161 mph) and gusts to 315 kph (196 mph). At the time, the storm was over open waters, missing the island nation’s Palmerston atoll by 160 kilometers. The images, however, reveal lower wind speeds. This is because the power of the storm makes accurate measurements difficult. The scatterometer sends pulses of microwave energy through the atmosphere to the ocean surface, and measures the energy that bounces back from the wind-roughened surface.The energy of the microwave pulses changes depending on wind speed and direction, giving scientists a way to monitor wind around the world. Tropical cyclones, however, are difficult to measure. To relate the radar energy return to actual wind speed, scientists compare measurements taken from buoys and other ground stations to data the satellite acquired at the same time and place. Because the high wind speeds generated by cyclones are rare, scientists don't have corresponding ground information to know how to translate data from the satellite for wind speeds above 50 knots (about 93 kilometers per hour or 58 miles per hour). Also, the unusually heavy rain found in a cyclone distorts the microwave pulses in a number of ways, making a conversion to accurate wind speed difficult. Instead, the scatterometer provides a nice picture of the relative wind speeds within the storm and shows wind direction.
After these images were taken, Cyclone Percy weakened and continued to move south. It is expected to continue to weaken and should just sideswipe the more populated capital of the Cook Islands, Rarotonga. Earlier in the week, Percy destroyed most of the structures on Pukapuka and Nassau, two of the northern Cook Islands.
References & Resources
NASA image courtesy the QuickSCAT Science Team at the Jet Propulsion Laboratory.


