


![Request for Information – Potential [Placeholder for Prize]](https://assets.science.nasa.gov/dynamicimage/assets/science/psd/solar/2023/09/s/solarsystem_0.jpg?w=1024)


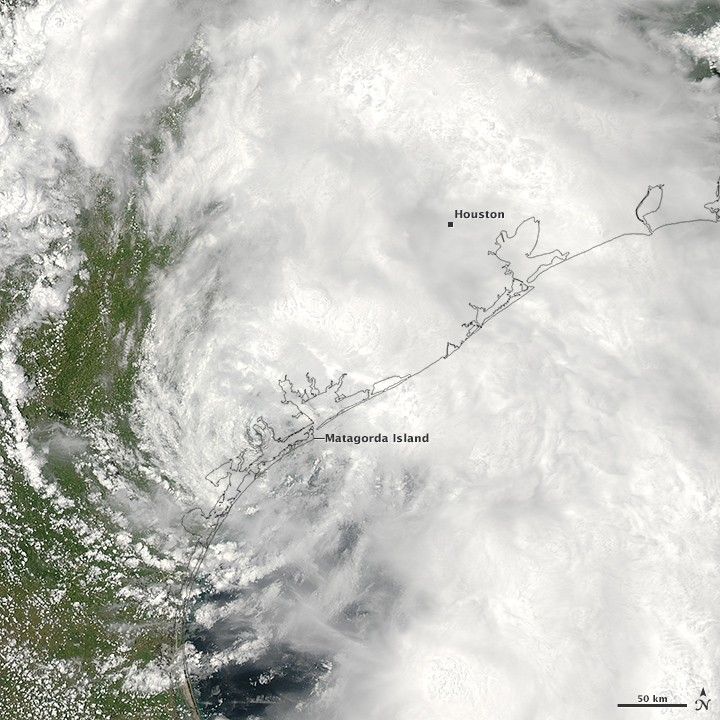
The second named tropical storm of the 2015 Atlantic hurricane season—Bill—was also the second to make landfall. (The first, Ana, hit South Carolina in May.) While Bill’s winds were not particularly strong when it pushed ashore near Matagorda Island, forecasters are warning that the storm could cause dangerous flooding in central Texas and Oklahoma, areas that were recently swamped with drenching rain and floods.
In fact, soils in Texas are so saturated that some forecasters say Bill could possibly strengthen after making landfall. Normally tropical storms decay rapidly after reaching land because they get cut off from evaporating ocean water, their main energy source. However, researchers recently found that storms occasionally maintain their strength or even strengthen after landfall if soils are wet enough, a process known as the “brown ocean effect.”
The Moderate Resolution Imaging Spectroradiometer (MODIS) on NASA’s Aqua satellite acquired a natural-color image (top) of Tropical Storm Bill at 2:05 p.m. local time (1955 Universal Time) on June 16, 2015. One hour before the image was acquired, the storm's maximum sustained winds were estimated to be 95 kilometers (60 miles) per hour, according to the National Hurricane Center.
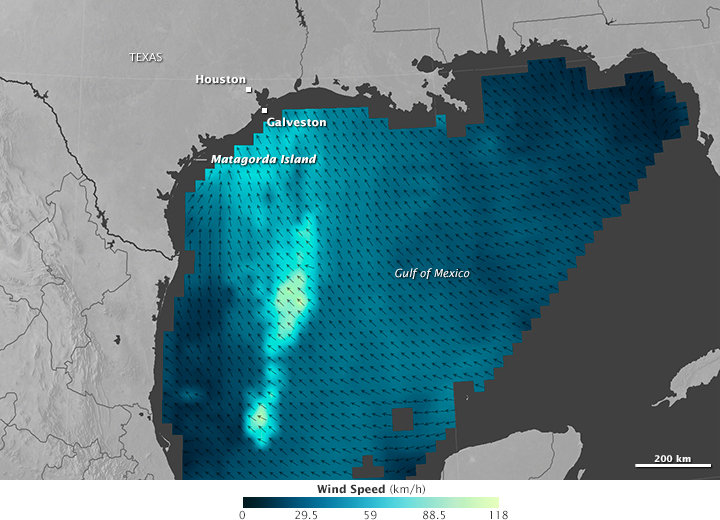
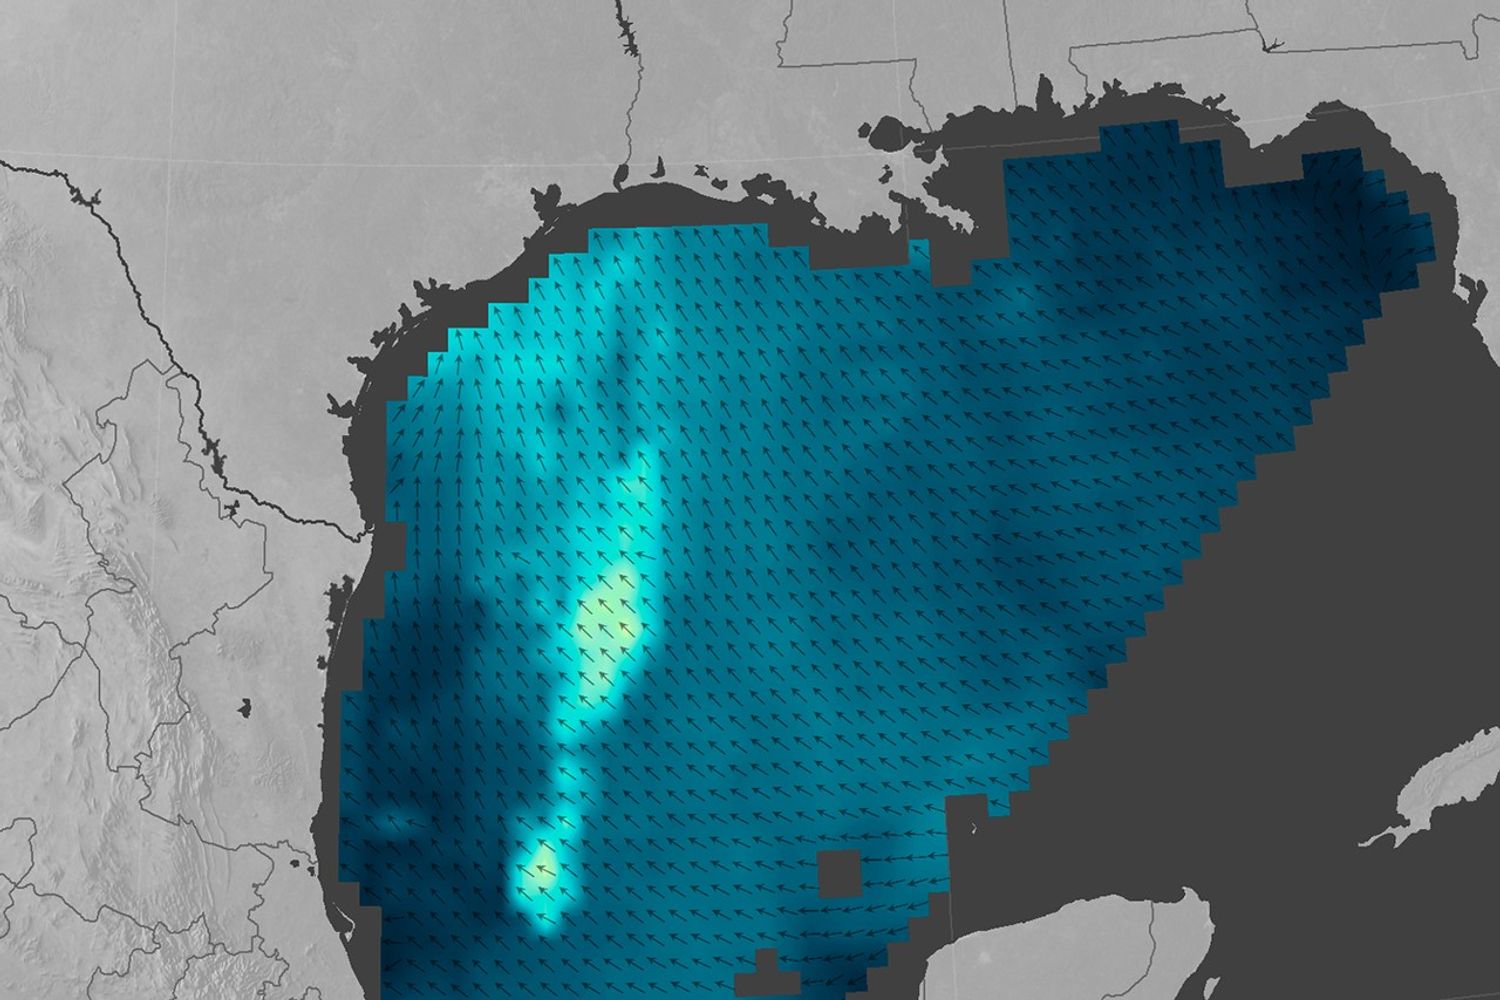
The second image shows wind speed and direction near the ocean surface, as measured from space around 1:30 p.m. (1930 Universal Time) on the same day. Winds dissipated as the storm moved onshore, although a few pockets of strong wind were still present. The measurements were taken by the International Space Station-Rapid Scatterometer (ISS-RapidScat), which bounces microwave pulses off the ocean and measures the roughness of the surface. Rough waters are disturbed more by wind and return a stronger signal than smooth waters; from this information, scientists can derive speed and direction. Shades of blue-green indicate the range of speeds, with lighter shades representing stronger surface winds.
References & Resources
- Mashable (2015, May 27) Tropical Depression Bill feasting on saturated soil, spreads heavy rain beyond Texas. Accessed June 17, 2015.
- National Hurricane Center (2015, June 4) Hurricane BILL Advisory Archive. Accessed June 17, 2015.
- The Weather Channel (2015, June 17) Tropical Depression Bill Inland Over Texas; Major Flood Threat Ramps Up For Texas, Oklahoma, Ozarks . Accessed June 17, 2015.
- Weather Underground (2015, June 16) Tropical Storm Bill Moving Ashore Over Texas. Accessed June 17, 2015.
NASA Earth Observatory map (bottom) by Joshua Stevens, using RapidScat data from the Jet Propulsion Laboratory . NASA image (top) by Jeff Schmaltz, LANCE/EOSDIS Rapid Response . Caption by Adam Voiland.