


- August 4 (500 KB)
- August 4 - slice (400 KB)
- August 10 (500 KB)
- August 11 (650 KB)
The 2004 Atlantic hurricane season continues to heat up as Tropical StormBonnie, the first of two currently active storms in the Atlantic, makeslandfall along the panhandle of Florida. The Tropical Rainfall MeasuringMission (or TRMM) satellite has followed Bonnie's progress from a weaktropical depression east of the Lesser Antilles til landfall as a tropicalstorm along the northern coast of Florida. The images and data providedby TRMM can give valuable estimates of both storm location as well asestimates of storm intensity to the the NOAA Tropical Prediction Center(also known as the National Hurricane Center).
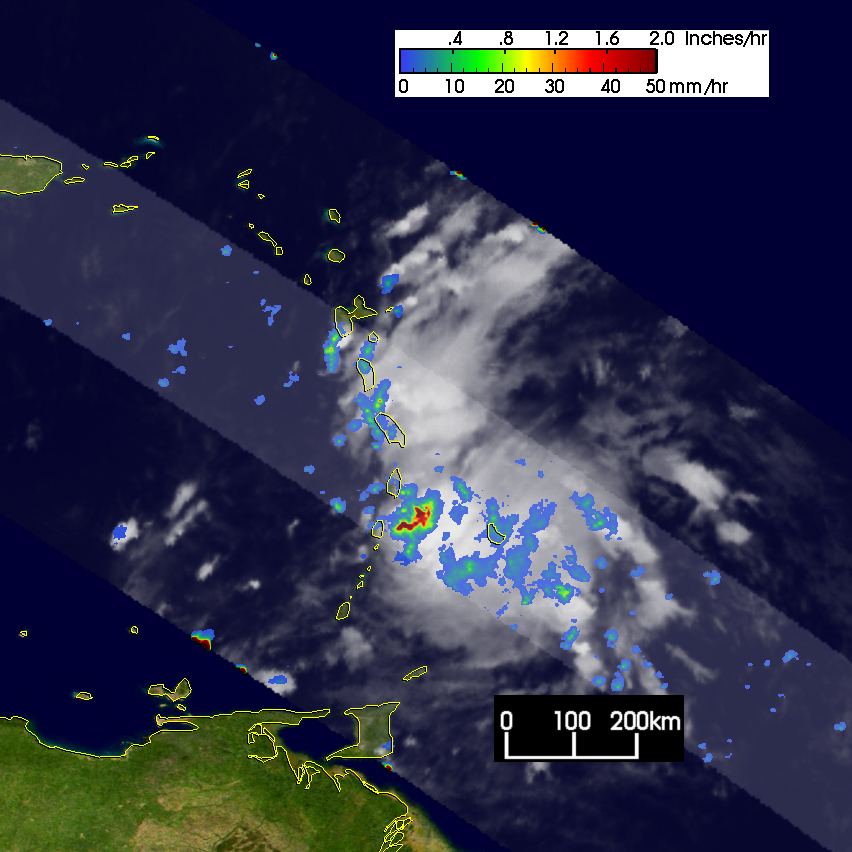
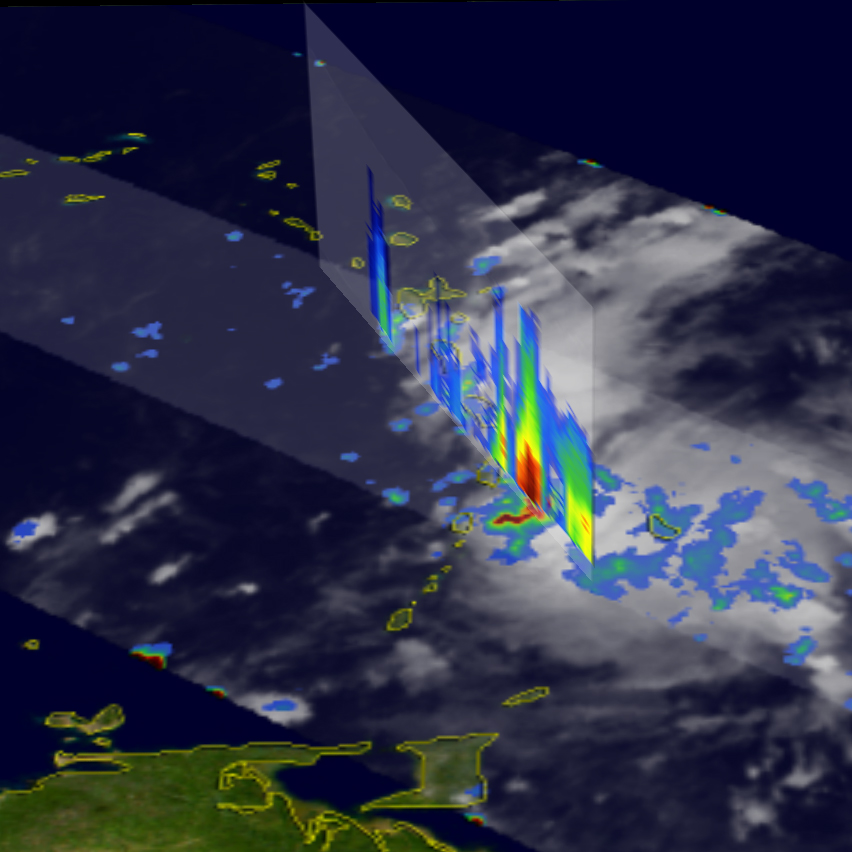
Bonnie first began as tropical depression number two (TD #2) on the 3rd ofAugust 2004 approximately 350 miles east of Barbados. The first image wastaken the next day at 08:14 UTC (4:14 am EDT) on 4 August 2004. The imagedisplays the horizontal distribution of rain intensity obtained from the TRMMsatellite. Rain rates in the center part of the swath are from the TRMMPrecipitation Radar (PR), the first and only precipitation radar in space.The PR can provide fine resolution rainfall data and details on the verticalstructure. Rain rates in the outer swath are from the TRMM Microwave Imager(TMI). The rain rates are overlaid on infrared (IR) data from the TRMMVisible Infrared Scanner (VIRS). The image reveals that TD #2 is ratherpoorly organized. No banding is evident in the rain field. The system doescontain an area of heavy rain (red area) near the forward edge of the cloudshield between Barbados and St. Lucia and St. Vincent. At the time of theimage, Bonnie was still a weak tropical depression with maximum sustainedwinds estimated at just 30 knots (35 mph) by the National Hurricane Center.The second image taken at the same time shows a vertical cross sectionthrough the heavy rain area from the PR. The rain area is associated withstrong convection as evidenced by the deep tower (green area) above theheavy rain (red area). The view is looking north.
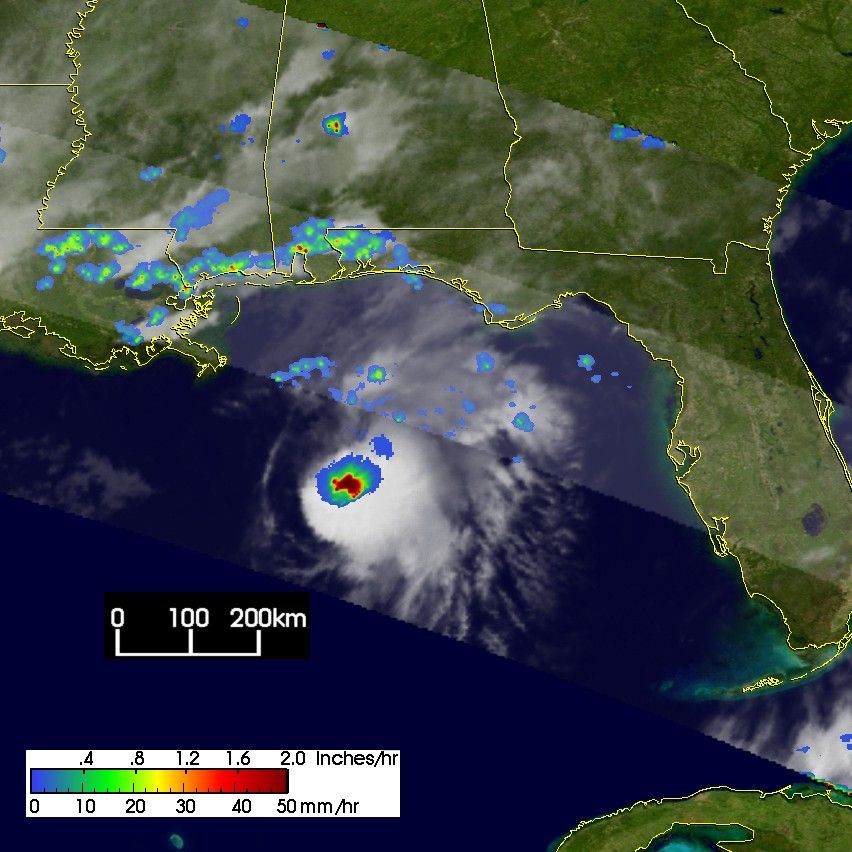
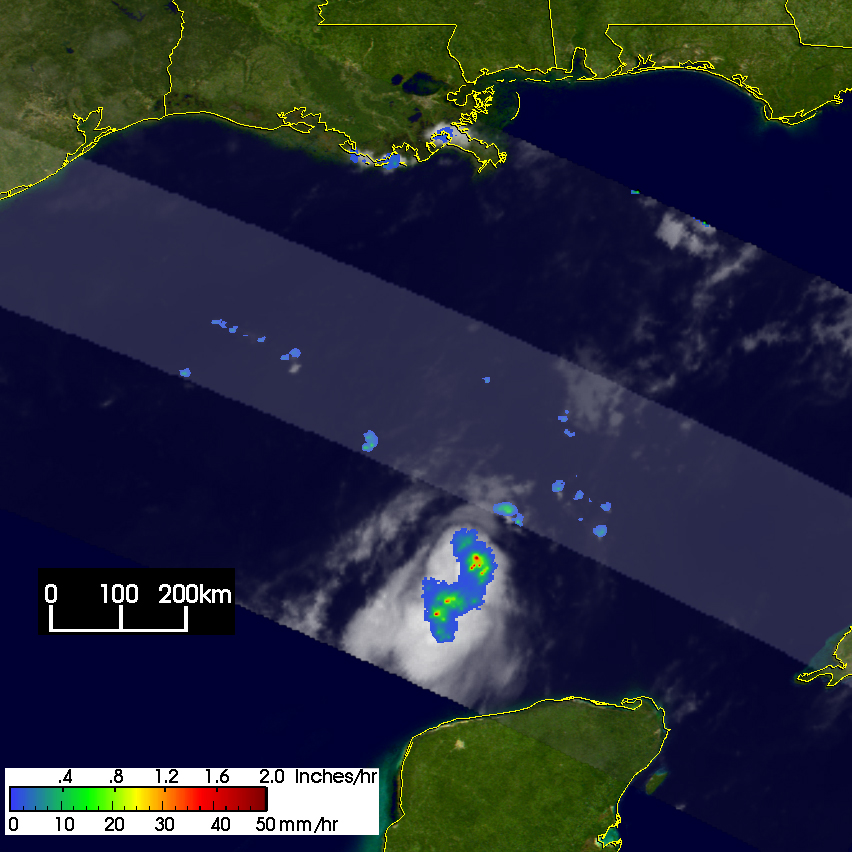
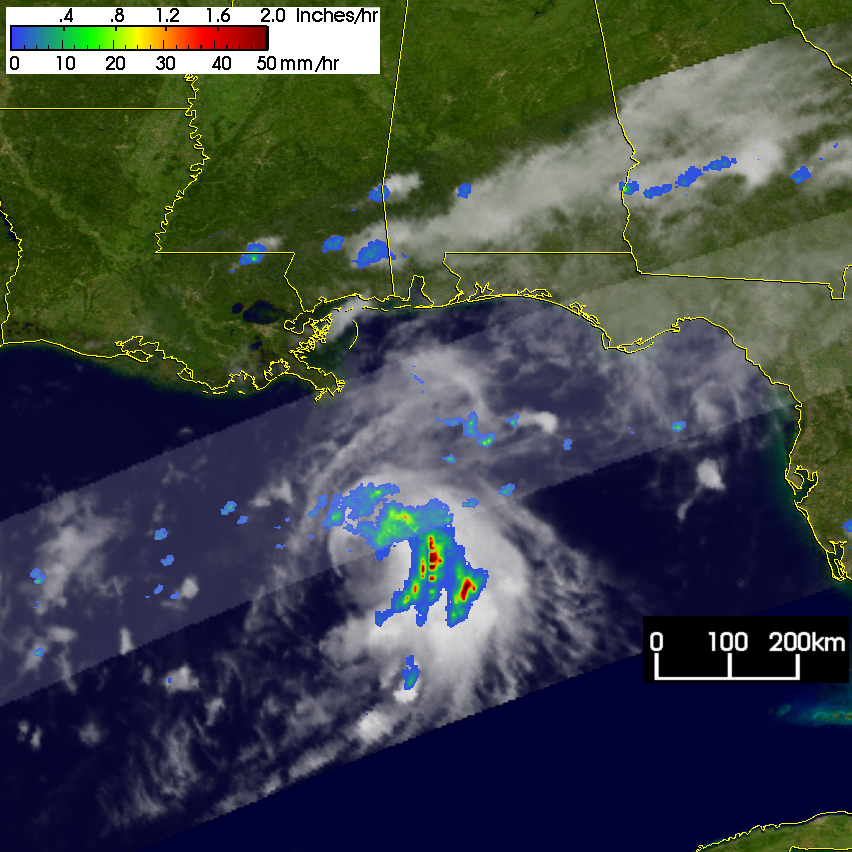
TD #2 however was not able to maintain itself and degenerated back into anopen wave soon after entering the eastern Caribbean as a result ofencountering unfavorable wind shear. Over the next several days, the wavetracked westward around the southern periphery of a subtropical ridge toits north before emerging into the Gulf of Mexico north of the YucatanPeninsula. At this point the wave re-intensified into a tropical storm andbecame Bonnie. The next image shows Bonnie over the north central Gulfof Mexico as it is approaching the panhandle of Florida. The image wastaken at 22:55 UTC (6:55 pm EDT) on Wednesday August 11. TRMM shows thatBonnie does not have an eye but that there is banding in the rain field eastof the center (green arcs). Most of the rain including some that is heavy(red) is on the north and east side of the storm. At this time, Bonnie wasa strong tropical storm with winds of 55 knots (63 mph). Bonnie was notable to intensify any further however as the storm was being pullednortheastward ahead of an upper-level trough. The final image taken just afew hours later at 03:49 UTC August 12th (11:49 pm EDT August 11) shows thatBonnie was a small storm. An isolated area of intense rain (dark red area)is all that remains. Winds were down to 50 knots (58 mph). Bonnie wouldmake landfall the next day near Apalachicola, FL as a tropical storm.
TRMM is a joint mission between NASA and the Japanese space agency JAXA.
References & Resources
Images produced by Hal Pierce (SSAI/NASA GSFC) and caption by Steve Lang (SSAI/NASA GSFC), NASA's Tropical Rainfall Measuring Mission.


