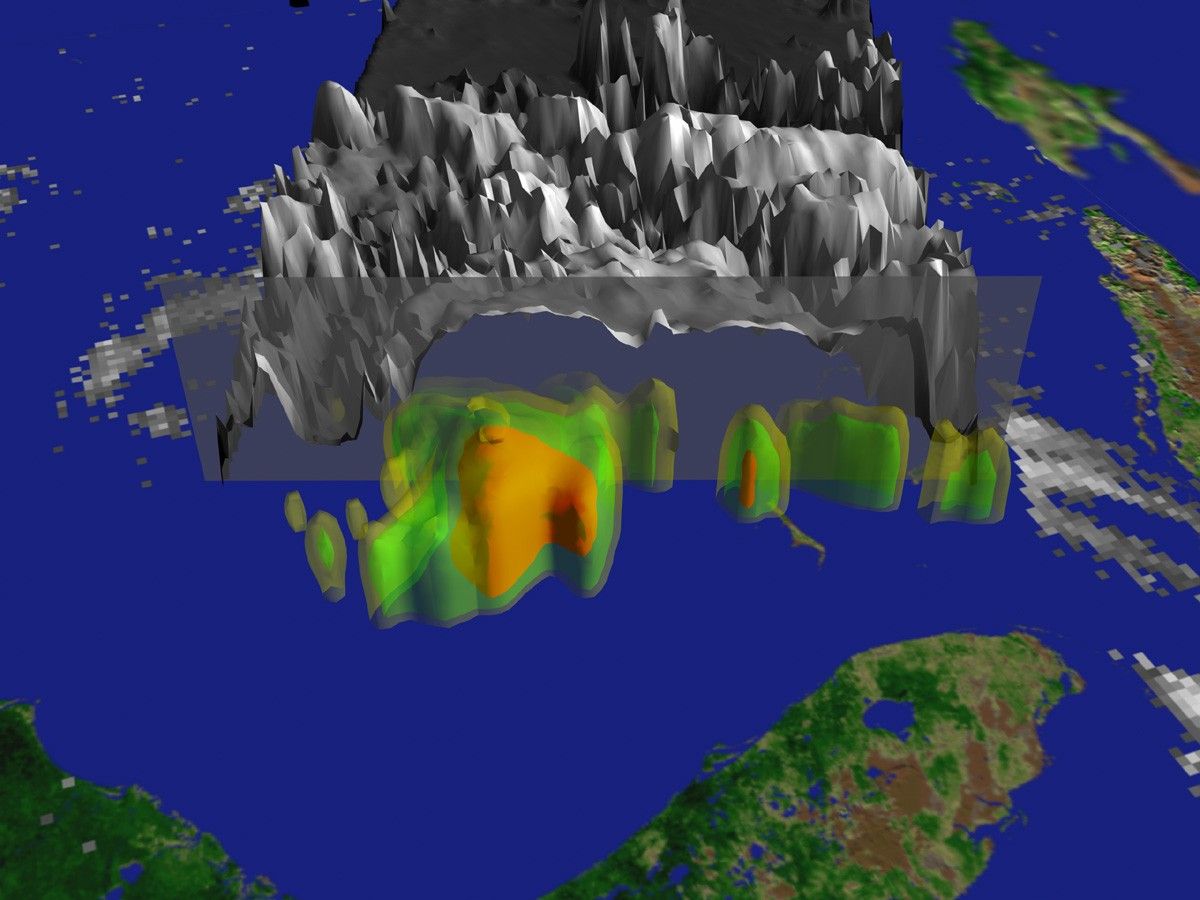


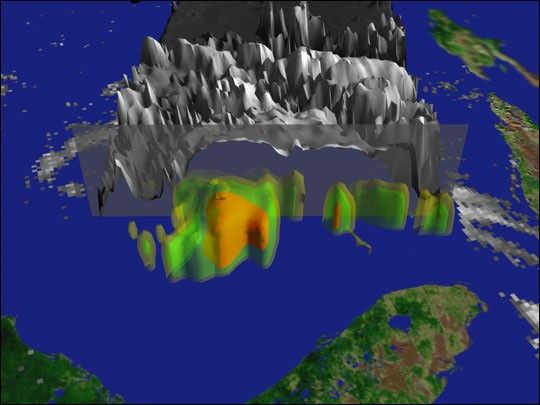
The above image is from an animation (4.1 MB MPEG) that displays the rainfall rates within the Tropical Storm Cristobal on August 7, 2002, as it passed just to the east of St. Augustine, Florida. Yellow represents 0.5 to 1 inches of rain, green represents 1 to 2 inches of rain, and red represents rainfall levels of 2 inches and up. The rainfall data were obtained by the Precipitation Radar aboard NASA’s Tropical Rainfall Measuring Mission (TRMM) satellite. The Precipitation Radar bounces radio waves off of clouds to retrieve a reading of the number of large, rain-sized droplets within the clouds. Using these data, scientists can tell how much precipitation is occurring within and beneath a hurricane. Cristobal was the third named tropical storm of the 2002 Atlantic hurricane season and packed sustained winds of up to 45 miles per hour.
References & Resources
This visualization was producted by the NASA/Goddard Space Flight Center Scientific Visualization Studio