


- June 8, 16:24 UTC (440 KB)
- June 8, 16:24 UTC - Vertical Slice (264 KB)
- June 8, 16:24 UTC (440 KB)
- June 8, 16:24 UTC - Vertical Slice (440 KB)
- Quicktime (.mov) format (428 KB)
- MPEG-1 (.mpg) format (928 KB)
- Quicktime (.mov) format (424 KB)
- MPEG-1 (.mpg) format (724 KB)
Typhoon Conson began as a weak tropical depressionalmost 12 days ago in the West Pacific south of the western CarolineIslands. The system moved steadily west-northwest without gaining anystrength as it passed through the central Philippines. On the 2nd of June2004, Conson emerged into the South China Sea west of the Philippines.Between the 4th and 7th, Conson traversed a slow loop over the South China Seawest of the main northern island of Luzon and strengthened into a tropicalstorm. On the 7th, Conson began moving towards the north-northeast andgathered enough strength to become a typhoon. The system continued its movementtowards the north-northeast on the 8th bringing it closer to southern Taiwan.The system also continued to strengthen. On the 9th, Typhoon Conson passedthrough the Bashi Channel just south of Taiwan before passing east of theisland.
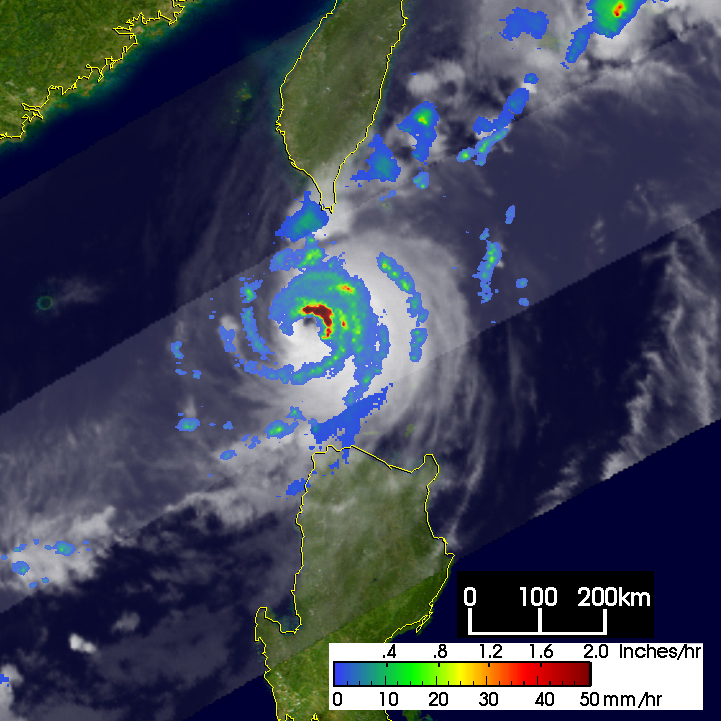
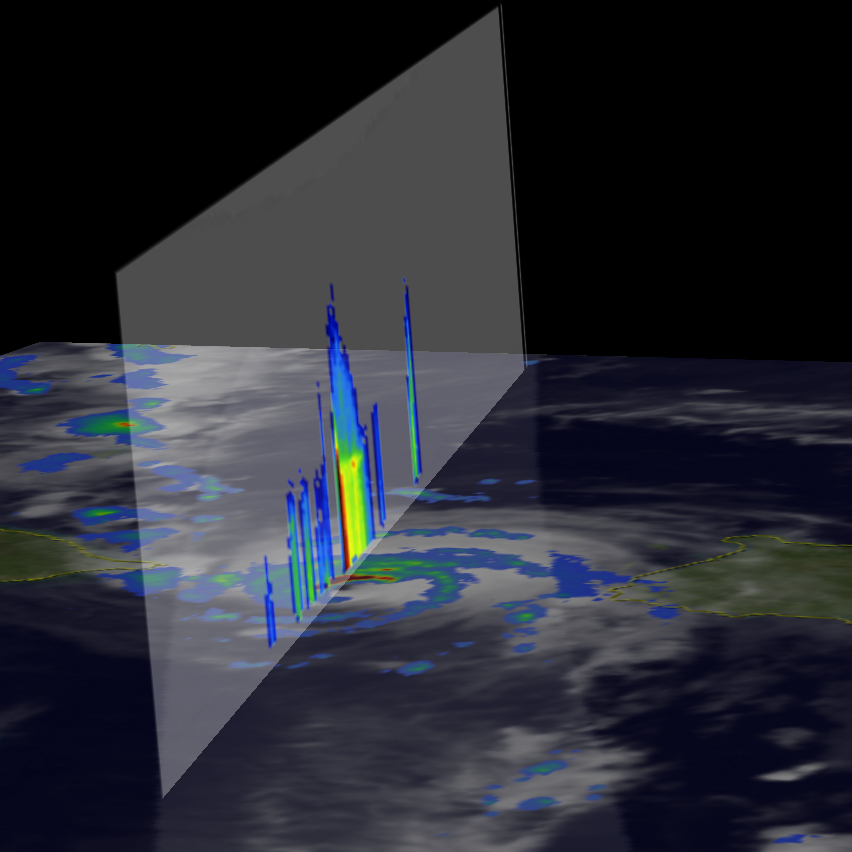
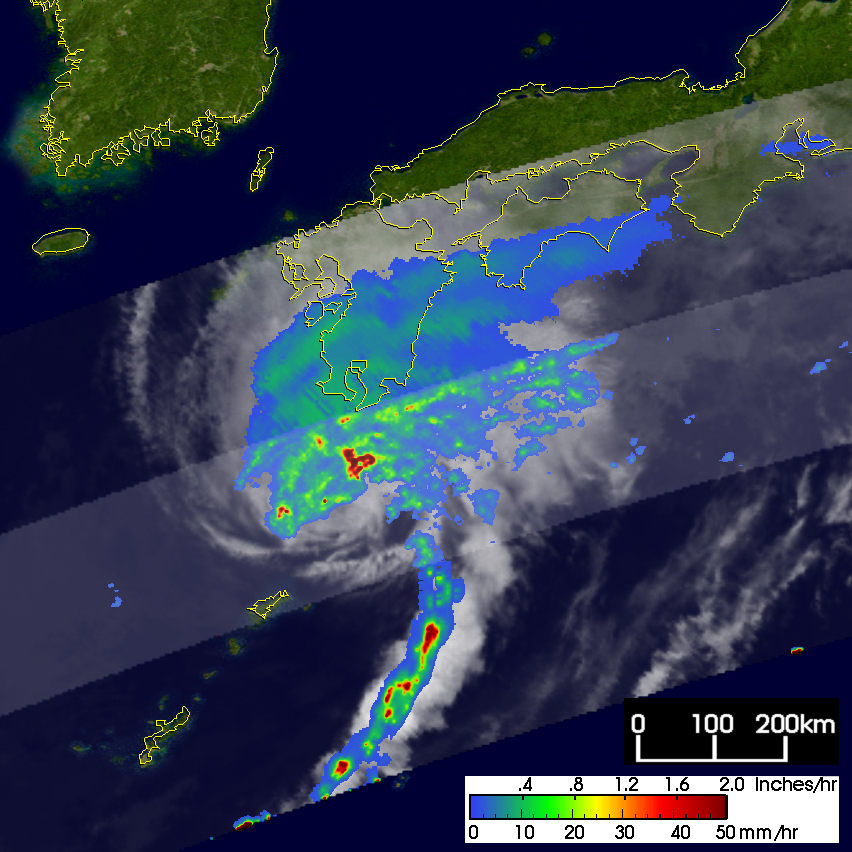
The Tropical Rainfall Measuring Mission (TRMM) satellite captured theseimages of Conson showing the storm's evolution from a tropical storm into atyphoon. The first image was taken at 17:32 UTC on 5 June 2004. It showsthe horizontal distribution of rain intensity. Rain rates in the centerswath are from the TRMM Precipitation Radar (PR), while rain rates in theouter swath are from the TRMM Microwave Imager (TMI). The rain rates areoverlaid on infrared (IR) data from the TRMM Visible Infrared Scanner(VIRS). At the time of the first image, Conson still just a tropicalstorm with winds estimated at 45 knots (52 mph) by the Joint TyphoonWarning Center. TRMM shows that the storm has a well-defined circulationbut lacks a complete eyewall with only moderate (green) rain intensitiesimmediately west of the center. Isolated heavier rain (red areas) occursin the outer rainbands. The next image taken at 16:24 UTC on the 8thshows a much stronger storm. The rainbands are tightly wrapped aroundthe center which now contains intense (dark red areas) rain areas in thenorthern and eastern part of the eyewall. These intense rainrates showwhere heat is being released that fuels the storm. The typhoon is nowover the Luzon Straight between the northern Philippines and southernTaiwan and has winds of 90 knots (104 mph). The next image was taken atthe same time and shows a vertical slice through the center of the stormlooking east. It shows the convection on the east side of the storm ismuch taller (blue areas above the yellow areas) and more intense (darkred area) than on the west side.
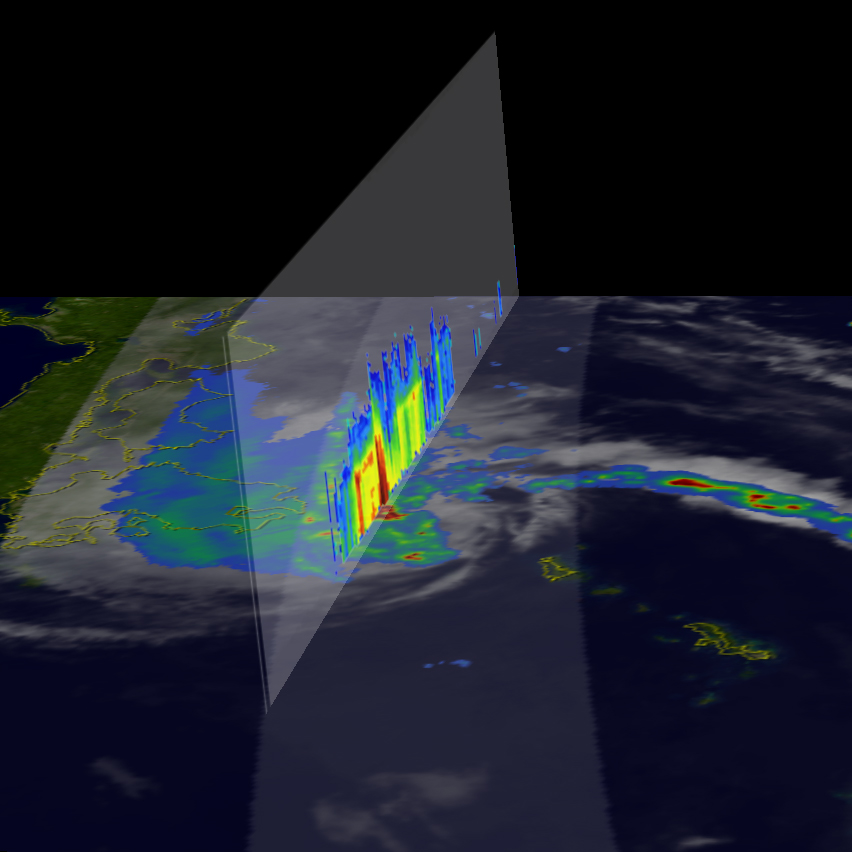
The last set of images were taken at 16:14 UTC on the 10th as Conson wasapproaching the southern islands of Japan. At this time, Conson isstarting to become extratropical as it accelerates to the northeast. Thetop down image reveals that the center has become ragged and disorganized.Some intense rainfall (dark reds) still exists north of the center and ina trailing rainband. The vertical slice taken through the convection northof the center looking east shows an area of intense rain (dark red area)and evidence of a bright band (horizontal red/yellow layer). Bright bandsare brought about by melting of larger ice particles. This final imagealso shows that the convective towers are not as deep as they were earlier(blue areas above the yellow areas).
TRMM is a joint mission between NASA and the Japanese space agency JAXA.
References & Resources
Images produced by Hal Pierce (SSAI/NASA GSFC) and caption by Steve Lang (SSAI/NASA GSFC), NASA's Tropical Rainfall Measuring Mission.


