![Request for Information – Potential [Placeholder for Prize]](https://assets.science.nasa.gov/dynamicimage/assets/science/missions/a-step/FFR_Earth_Background_20251120%20.png?w=1024)


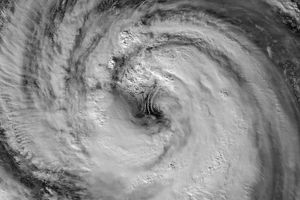
Typhoon Fitow was coming ashore over Honshu, Japan’s largest island, at 6:17 p.m. local time (9:17 UTC) on September 6, 2007, when the QuikSCAT satellite captured the data used to make this image. At this time, Fitow was a Category 2 typhoon, with peak winds around 160 kilometers/hour (100 mph; 85 knots). The image depicts wind speed in color and wind direction with small barbs. White barbs point to areas of heavy rain. As might be expected, the highest wind speeds (purple) and heaviest rains surround the eye of the storm. The eye itself is green, indicating calmer winds.
Typhoon Fitow became a named storm on August 29, 2007. The storm system gradually built in power as it drew towards the main islands of Japan, briefly reaching Category 2 strength, then weakening to Category 1 before rebuilding again. It was forecast to lose power as it tracked over Honshu. “Fitow” is a Micronesian word for a flower found on the island of Yap. The list of names of western Pacific storms, maintained by the Hong Kong Observatory, draws on Asian languages.
QuikSCAT measurements of the wind strength of Typhoon Fitow and other tropical cyclones can be slower than actual wind speeds. QuikSCAT’s scatterometer sends pulses of microwave energy through the atmosphere to the ocean surface and measures the energy that bounces back from the wind-roughened surface. The energy of the microwave pulses changes depending on wind speed and direction.
To relate the radar signal to actual wind speed, scientists compare measurements taken from buoys and other ground stations to data the satellite acquired at the same time and place. Because the high wind speeds generated by cyclones are rare, scientists do not have corresponding ground information to know how to translate data from the satellite for wind speeds above 50 knots (about 93 km/hr or 58 mph).
Also, the unusually heavy rain found in a cyclone distorts the microwave pulses in a number of ways, making a conversion to exact wind speed difficult. Instead, the scatterometer provides a nice picture of the relative wind speeds within the storm and shows wind direction.
References & Resources
NASA image courtesy of David Long, Brigham Young University, on the QuikSCAT Science Team , and the Jet Propulsion Laboratory.