
























- September 1, 2005 (374 kB)
- August 31, 2005 (339 kB)
- August 30, 2005 (276 kB)
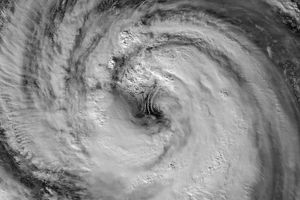
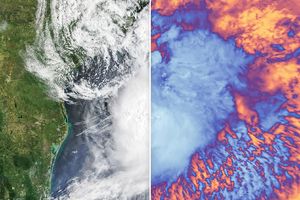
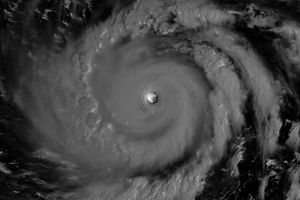
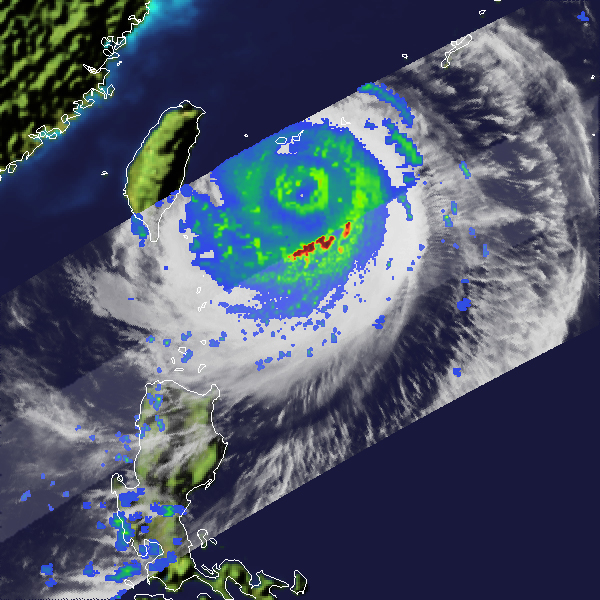
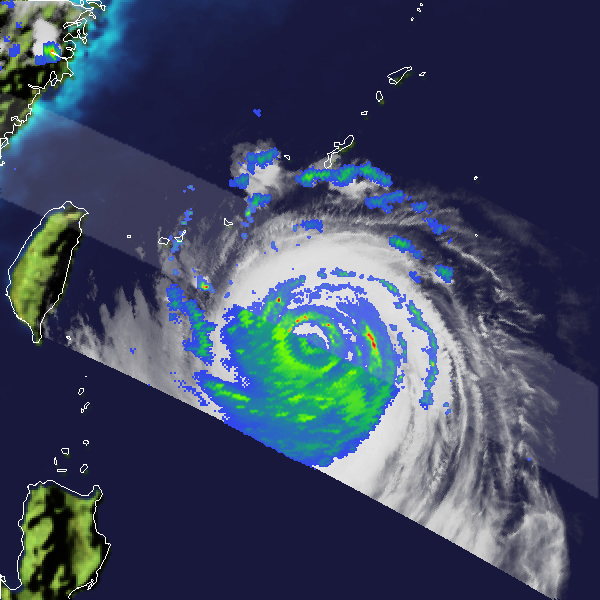
Taiwan took a direct hit from powerful Typhoon Talim on August 31, 2005. At the time, the storm was a Category 3 typhoon with maximum sustained winds estimated at 200 kilometers per hour (120 miles per hour) by the Joint Typhoon Warning Center. The storm cut directly across the island leaving at least 6 people dead. Talim then continued on to mainland China where there were 14 confirmed fatalities and another 15 persons missing. Nine of the fatalities and all the missing persons are a direct result of mudslides.
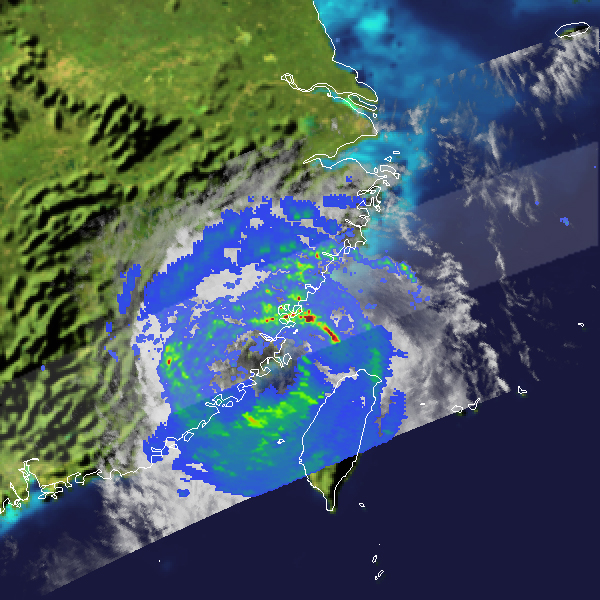
These images of Talim were captured by the Tropical Rainfall Measuring Mission (TRMM) satellite as the storm bore down first on Taiwan and then on China. The first image was taken at 12:24 UTC (8:24 p.m. Tapei time) on August 30, 2005, as the storm approached Taiwan. TRMM reveals that Talim had a large inner eye surrounded by a complete inner eyewall, which can be identified by the inner ring of moderate- intensity rain (the inner green ring) as well as an outer concentric eyewall (larger green ring). This double-eyewall structure can occur in mature, intense tropical cyclones.
The second image was taken on August 31, just before the storm made landfall over Taiwan when Talim was a Category 4 typhoon with maximum sustained winds estimated at 210 km/hr (130 mph). The storm still displayed a double eyewall, with areas of very heavy rain, shown in red, in the outer ring.
The third image shows Talim just after the center made landfall on the coast of mainland China. The image was taken at 1:38 p.m. Taipei time (05:38 UTC) on September 1, 2005. The inner eyewall is completely gone in this image with the storm having been disrupted by its passage over the mountainous terrain of Taiwan. At the time of this image, Talim was a Category 1 typhoon with sustained winds of 130 km/hr (80 mph). Talim quickly lost strength after coming ashore, though it continued to cause flooding and mudslides.
Launched in 1997, the TRMM satellite has served as a valuable platform for monitoring tropical cyclones, especially over remote parts of the ocean. The images show the horizontal distribution of rain intensity looking down on the storm. Rain rates in the center of the swath are from the TRMM Precipitation Radar (PR), while those in the outer portion are from the TRMM Microwave Imager (TMI). The rain rates are overlaid on infrared (IR) data from the TRMM Visible Infrared Scanner (VIRS).
TRMM is a joint mission between NASA and the Japanese space agency JAXA.
References & Resources
Images produced by Hal Pierce (SSAI/NASA GSFC) and caption by Steve Lang (SSAI/NASA GSFC).