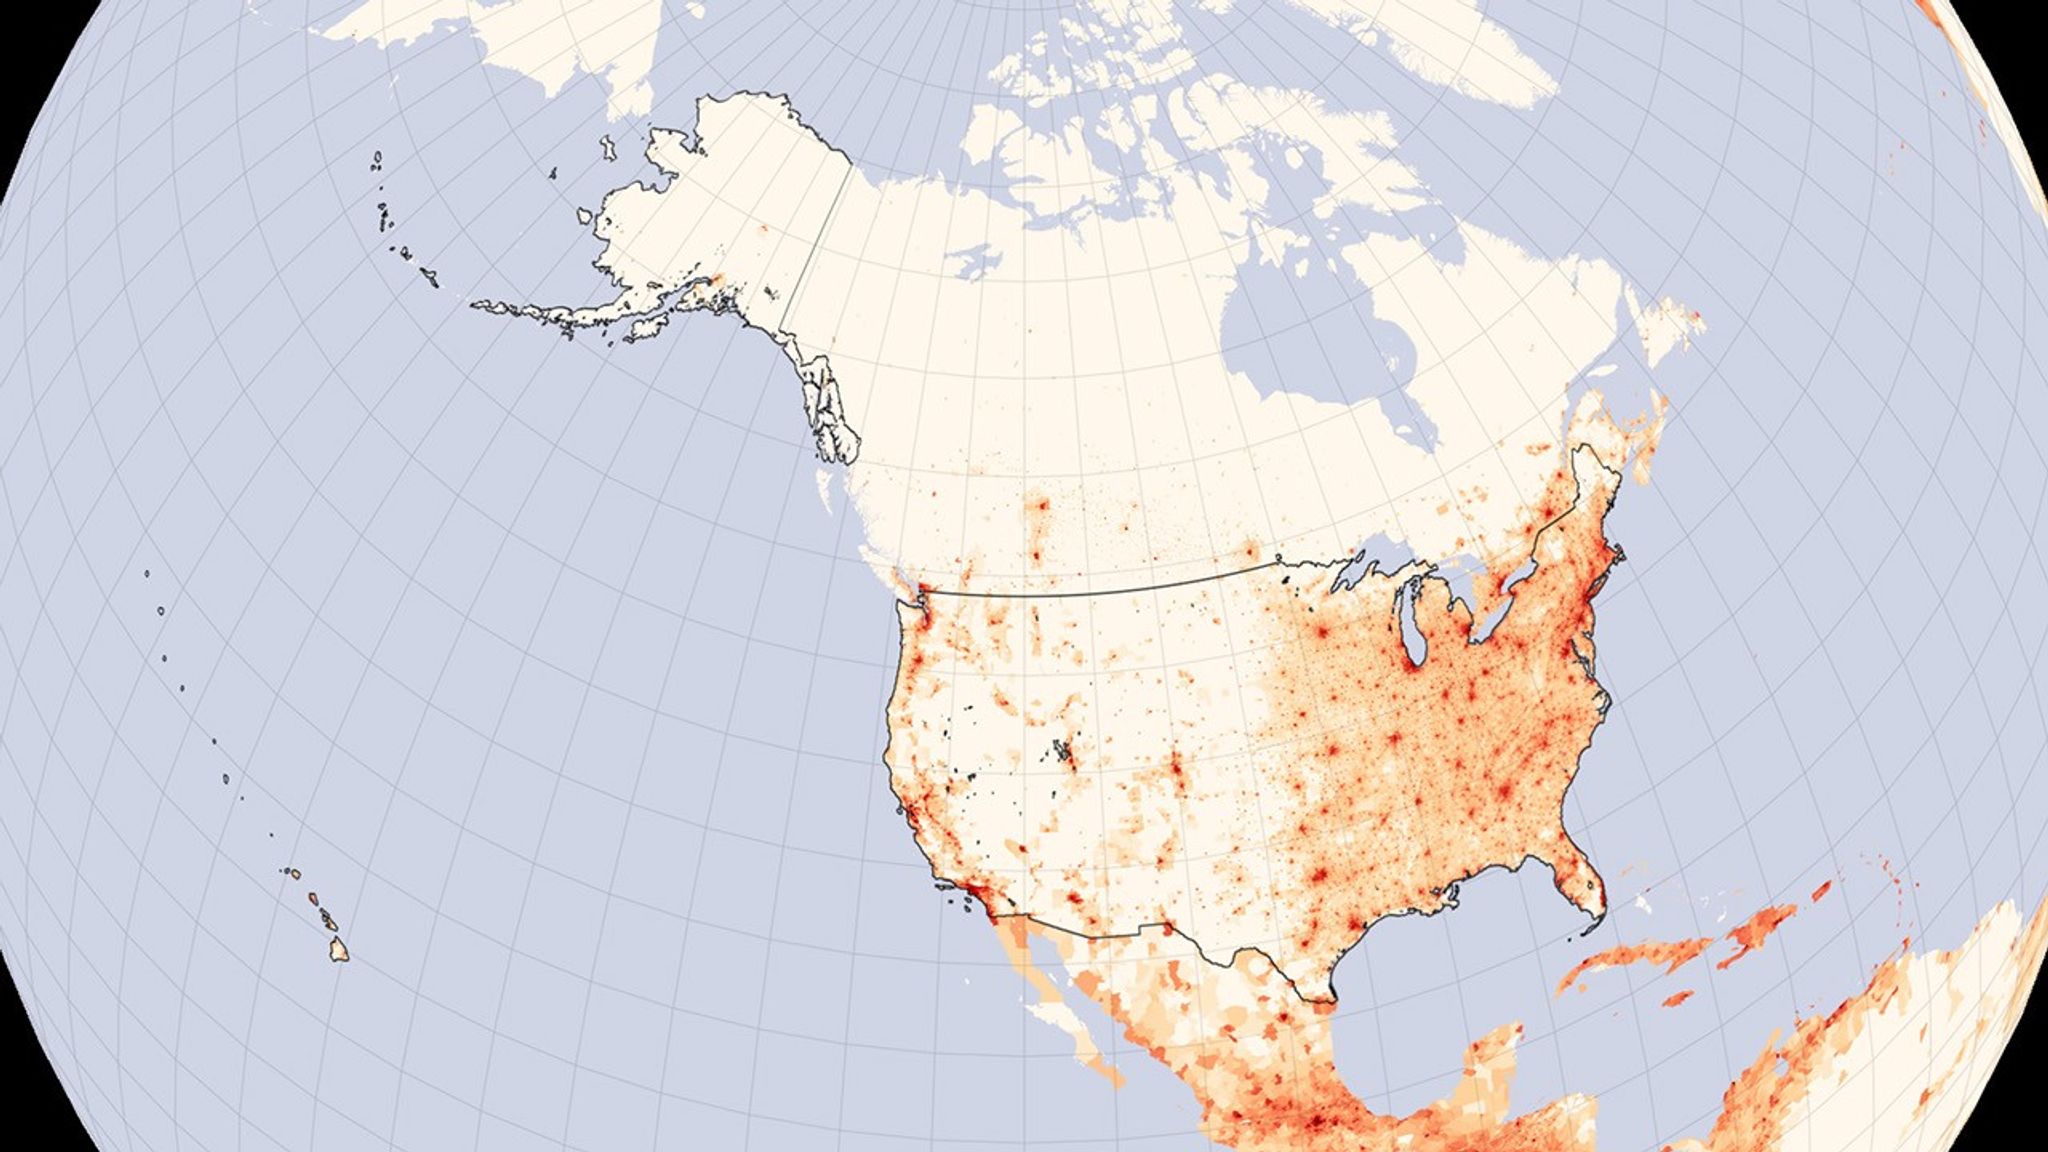





















The population of the United States reached 300 million on October 17, 2006, said the U.S. Census Bureau. With one birth every 7 seconds, a death every 13 seconds, and a migrant entering the country every 31 seconds, the United States’ population is growing at a rate of one person every 11 seconds. Where are all of these people living? This map, based on population estimates made in 2005, charts out the number of people in every square kilometer of the United States.
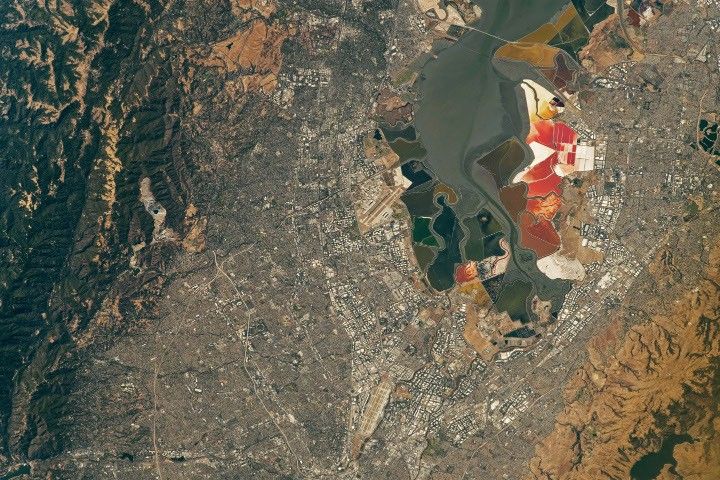
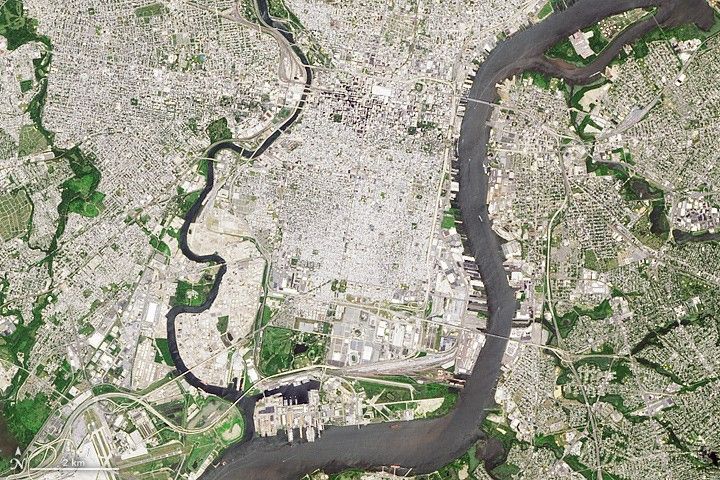
As has been the case historically, the most densely populated parts of the United States are east of the Mississippi River. Rings of decreasing population density radiate out from the major urban centers of New York, Philadelphia, and Washington along the East Coast. Other cities—Atlanta, Chicago, Houston, and Dallas—punctuate the map in the country’s interior. The west remains lightly populated except for clearly defined urban regions. Like their counterparts in the east, the largest cities in the west (San Diego and Los Angeles in the south; San Francisco, Oakland, and San Jose farther north) hug the coast, with the densest populations in Southern California. Other large western cities readily visible here include Portland, Seattle, Phoenix, and Denver.
For Earth scientists, population density maps can be crucial in answering questions about the relationship between people and the environment. How does population density relate to changes in land cover? How are natural resources distributed in relation to population? How do densely populated regions, with their pollution, artificial surfaces, and urban heat islands, affect climate? To answer these and other questions, scientists compare detailed population maps to other geographically based data sets, including satellite data. In the comparison, trends that track the human footprint can emerge.
This particular population density map is based on a global population density map created at the Socioeconomic Data and Applications Center (SEDAC) at Columbia University. One of the Distributed Active Archive Centers in NASA’s Earth Observing System Data and Information System, SEDAC provides information about human interactions in the environment.
- Further Reading:
- Location, Location, Location, on the Earth Observatory.
References & Resources
NASA image by Robert Simmon, based on data archived by the Socioeconomic Data and Applications Center