


In July 2011, NOAA’s National Climatic Data Center updated the U.S. Climate Normals: three-decade averages of weather observations, including temperature. The new annual normal temperatures for the United States reflect a warming world.
Following procedures set by the World Meteorological Organization, normals shift each decade, rather than each year. As of July 2011, the climate normals span 1981–2010, dropping the 1970s, which were unusually cool. Last year, the normals included 1971–2000, leaving out the warmest decade on record (2001–2010).
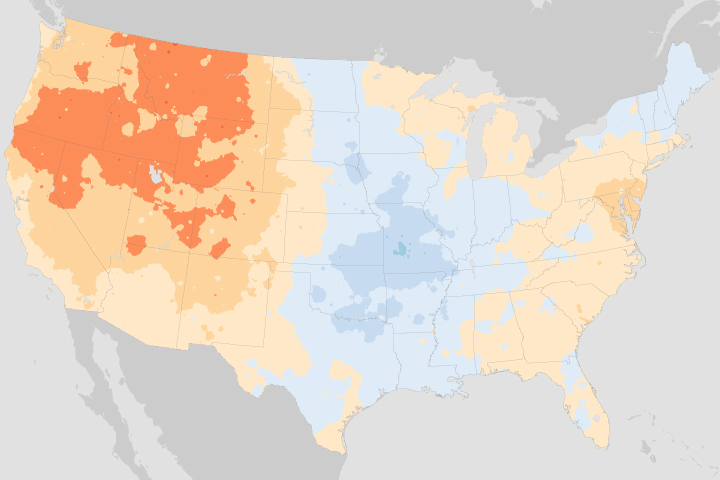
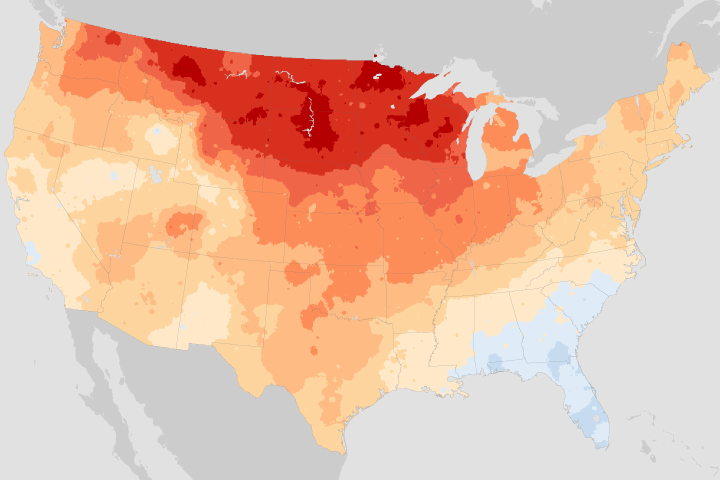
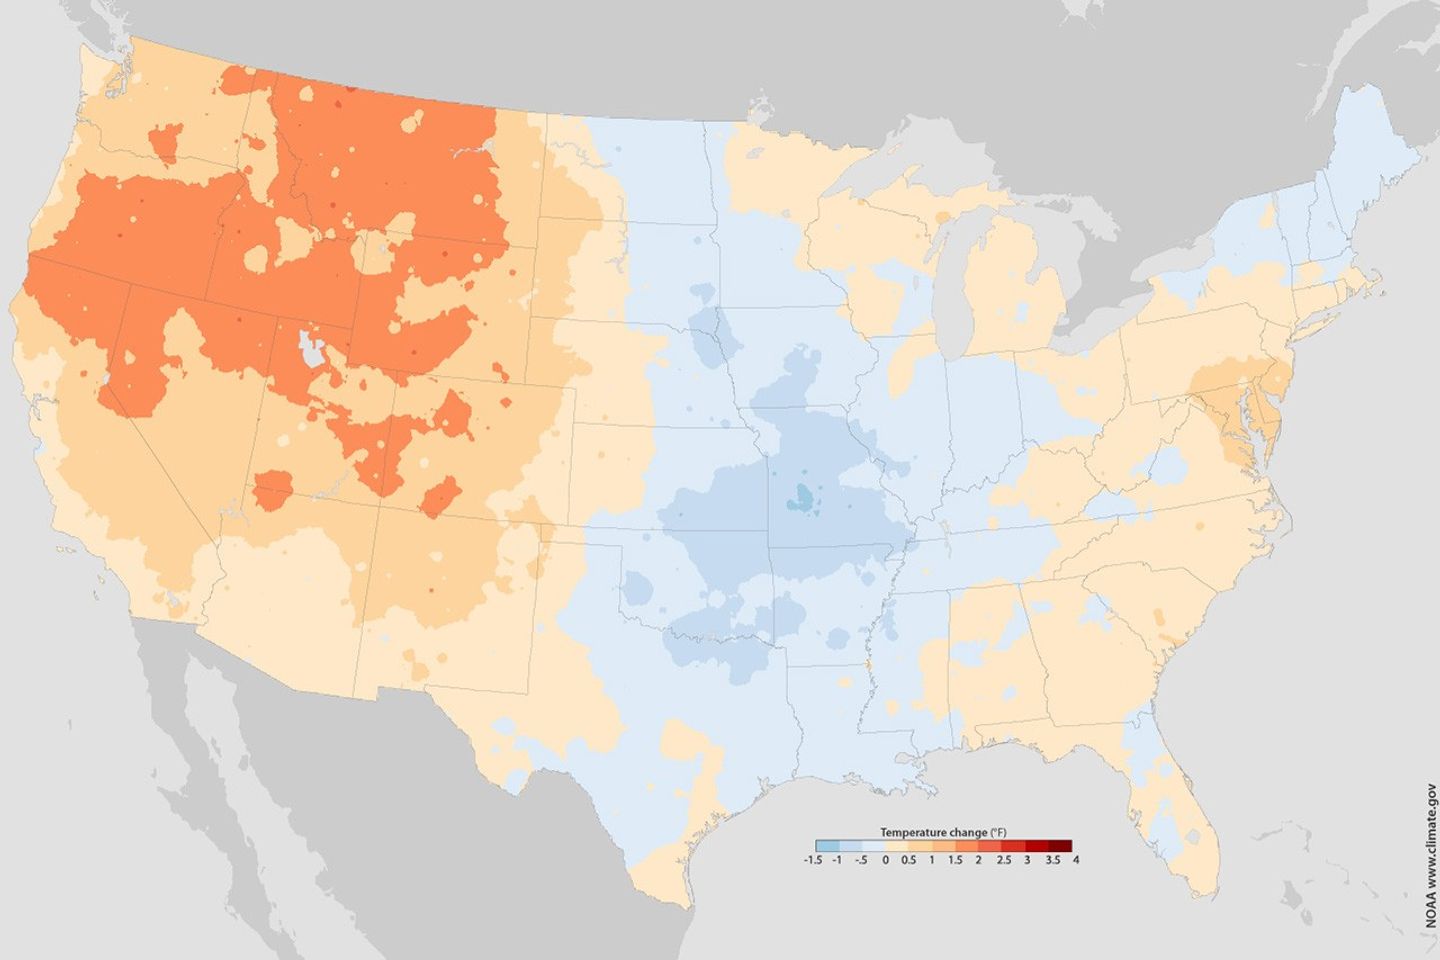
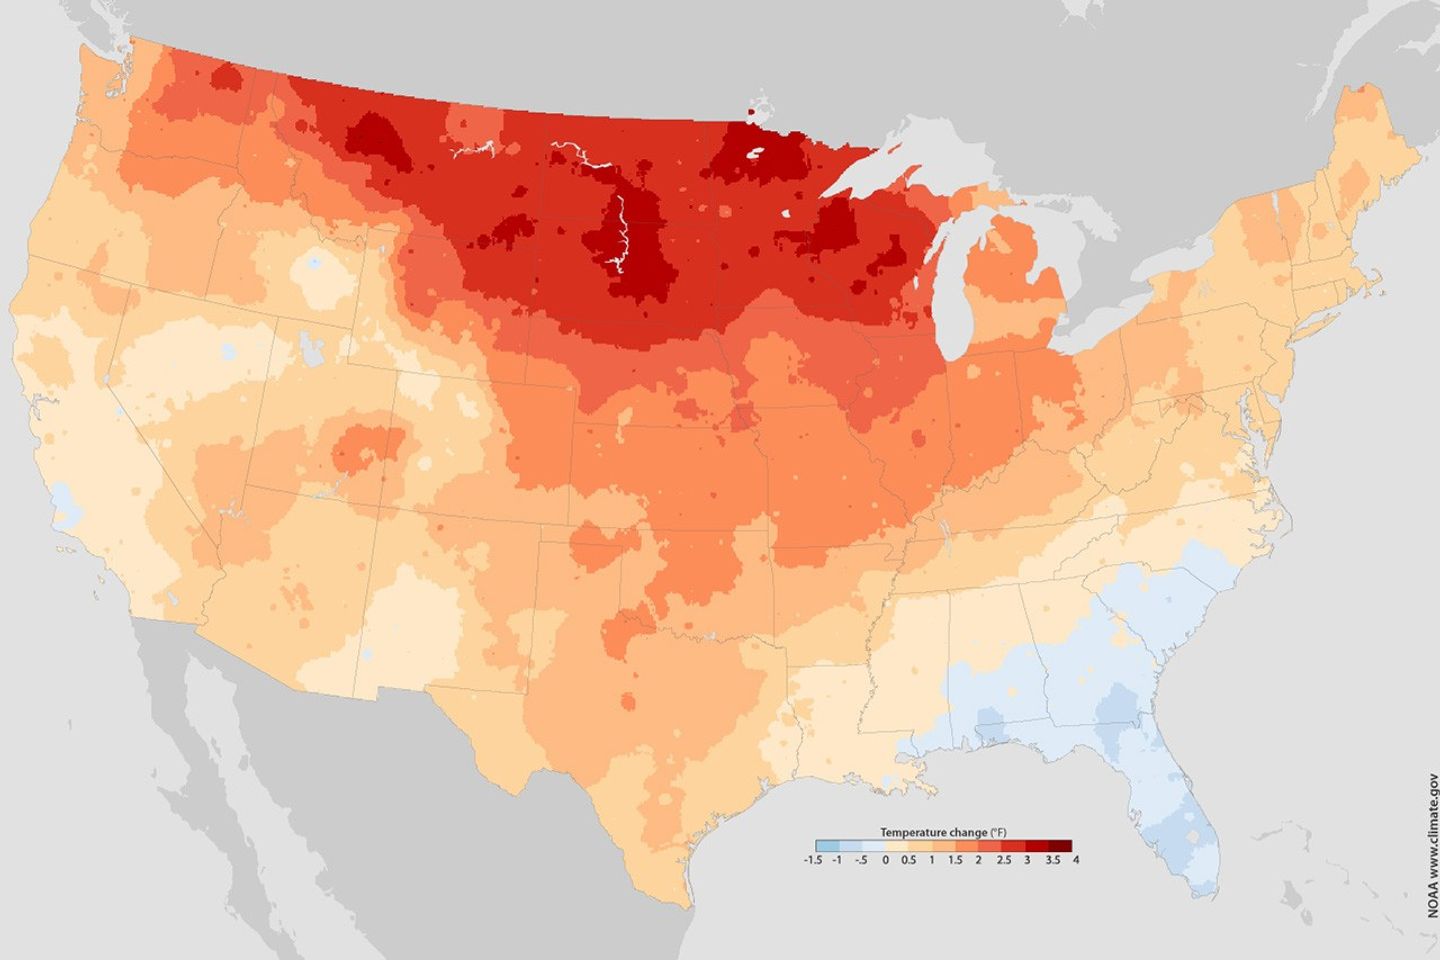
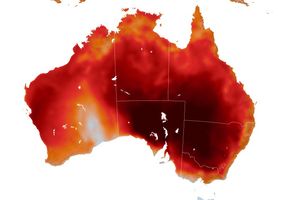
The maps above show the differences between the old normals and the new normals. The top image shows July maximum temperatures, and the bottom shows the January minimum temperatures. Positive temperature changes appear in orange and red, and negative temperature changes appear in blue.
On average, the contiguous United States experiences the lowest temperatures on January nights, and the highest temperatures on July days. Both January minimum temperatures and July maximum temperatures changed, but not by equal amounts.
Parts of the Great Plains, Mississippi Valley, and the Northeast experienced slightly cooler July maximums from 1981–2010 compared to 1971–2000 (top map). A much more striking difference, however, appears in the January minimums (bottom map). Nighttime temperatures in January were higher everywhere except the Southeast. Warmer nights were especially pronounced in the northern plains through the northern Rocky Mountains—about 4 degrees Fahrenheit (2 degrees Celsius) warmer in some places.
Comparing average temperatures year round, every state experienced warmer temperatures in 1981–2010 compared to 1971–2000.
Although warmer temperatures can have benefits, they pose hazards to some plants. For instance, higher nighttime temperatures enable some pests—such as the pine bark beetle and wooly adelgid—to thrive in places where they previously froze.
The National Climatic Data Center compiles climate normals from observations from thousands of stations in the National Weather Service (NWS) Cooperative Observer Program, as well as stations staffed by professionals within the NWS, the National Oceanic and Atmospheric Administration (NOAA), and the Federal Aviation Administration.
For more information about changing U.S. temperatures, see The New Climate Normals: Gardeners Expect Warmer Nights from NOAA’s ClimateWatch Magazine.
Links
- U.S. Climate Normals overview. National Climatic Data Center.
- Impact of climate change on agriculture. U.S. Global Change Research Program.
References & Resources
Maps by NOAA. Caption by Michon Scott, based on The New Climate Normals by Jennifer Freeman.


