


Trees are one of Earth’s largest banks for storing the carbon that gets emitted by natural processes and human activities. Forests cover about 30 percent of the planet’s surface, and as much as 45 percent of the carbon stored on land is tied up in forests.
But did global forests hold more or less carbon in the past? And could they store more in the future? Does it matter where those trees are growing? Scientists really don’t know. But before they can find out, they’ll need a reliable inventory of what is growing today.
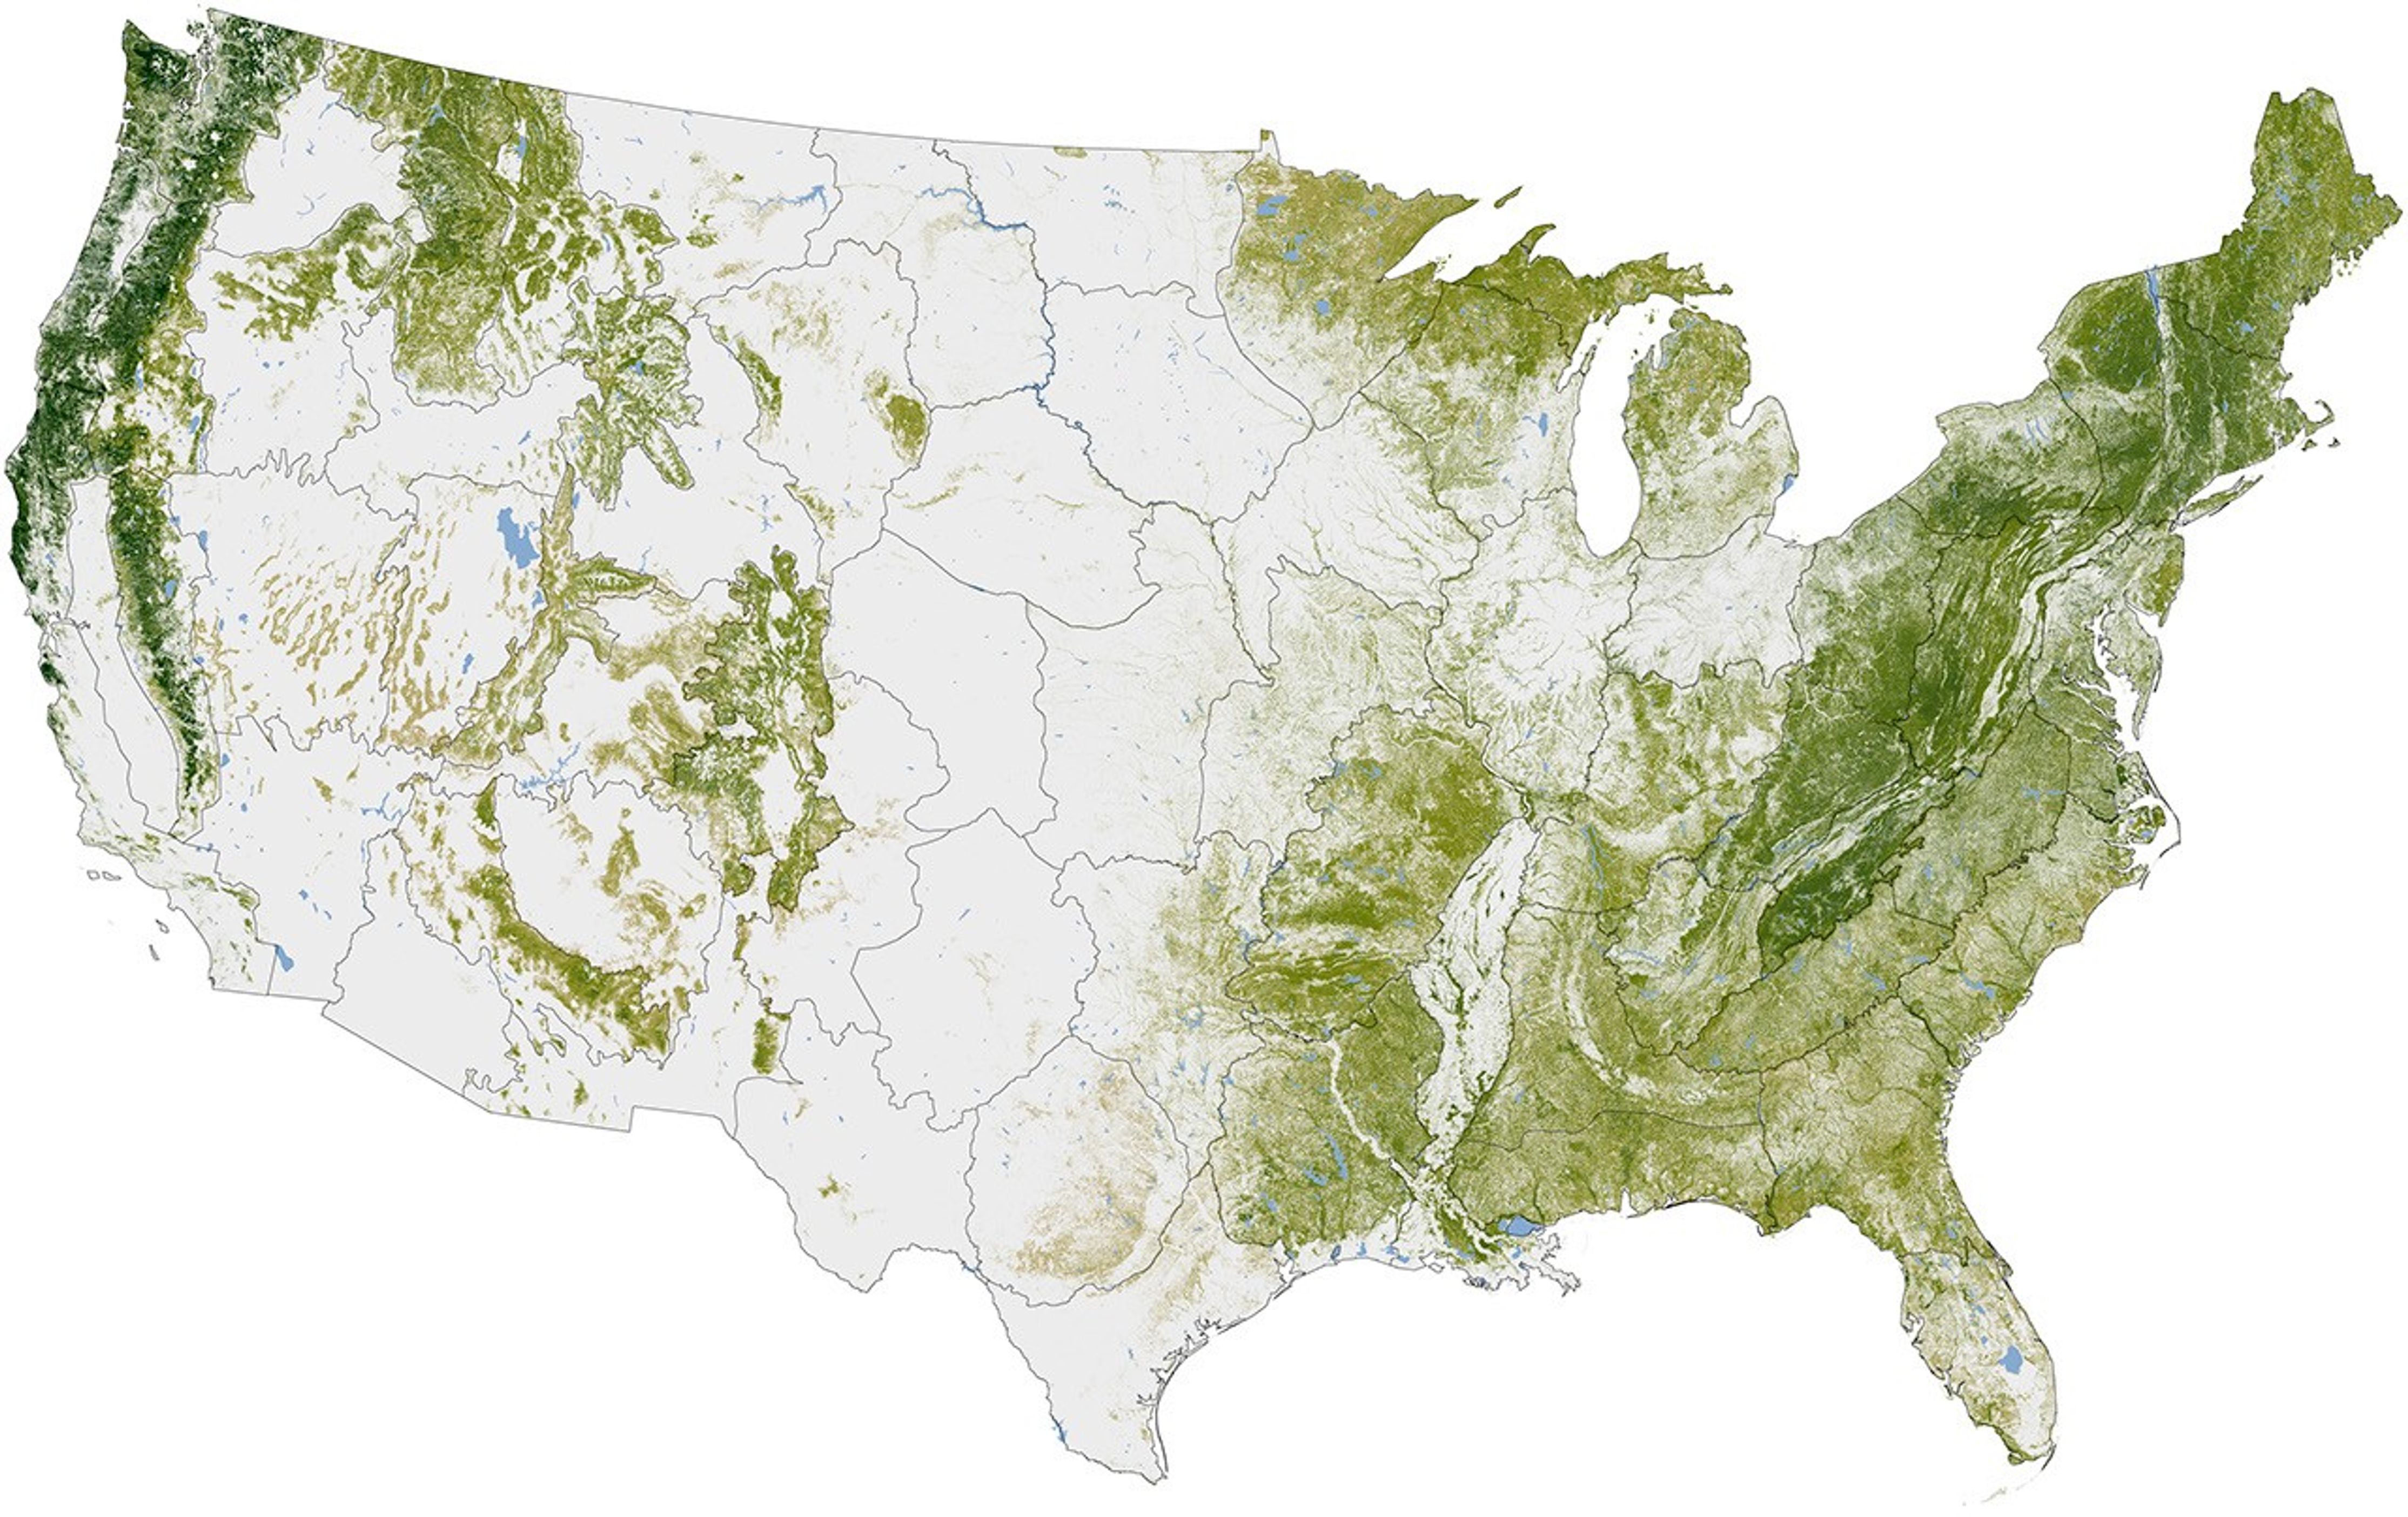
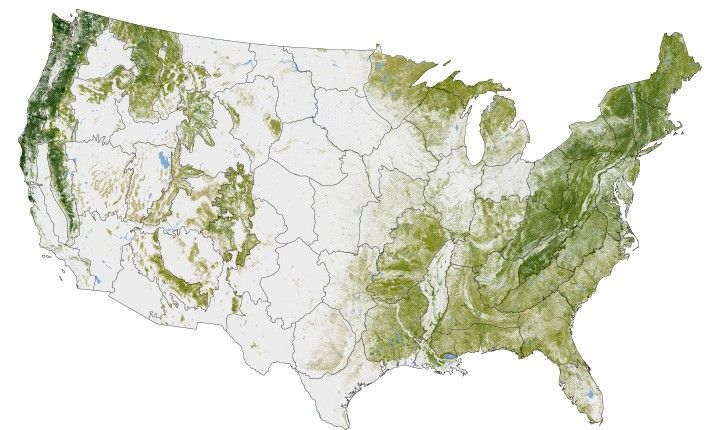
Josef Kellndorfer and Wayne Walker of the Woods Hole Research Center (WHRC) recently worked with colleagues at the U.S. Forest Service and U.S. Geological Survey to create such an inventory for the United States. The map above was built from the National Biomass and Carbon Dataset (NBCD), released in 2011. It depicts the concentration of biomass—a measure of the amount of organic carbon—stored in the trunks, limbs, and leaves of trees. The darkest greens reveal the areas with the densest, tallest, and most robust forest growth.
Over six years, researchers assembled the national forest map from space-based radar, satellite sensors, computer models, and a massive amount of ground-based data. It is possibly the highest resolution and most detailed view of forest structure and carbon storage ever assembled for any country.
Forests in the U.S. were mapped down to a scale of 30 meters, or roughly 10 computer display pixels for every hectare of land (4 pixels per acre). They divided the country into 66 mapping zones and ended up mapping 265 million segments of the American land surface. Kellndorfer estimates that their mapping database includes measurements of about five million trees.
“Forests are a key element for human activity,” says Kellndorfer. “Resource managers need to see forests down to the disturbance resolution—the scale at which parking lots or developments or farms are carved out by deforestation. We have to know how much we have, and where, in order to conduct sound management and harvesting.”
Learn more about the creation of Kellndorfer’s map and other attempts to measure Earth's forests in our newest feature story: Seeing Forests for the Trees and the Carbon: 
Mapping the World’s Forests in Three Dimensions.
References & Resources
NASA Earth Observatory map by Robert Simmon, based on multiple data sets compiled and analyzed by the Woods Hole Research Center. Data inputs include the Shuttle Radar Topography Mission, the National Land Cover Database (based on Landsat) and the Forest Inventory and Analysis of the U.S. Forest Service. Caption by Michael Carlowicz.