


Carbon Dioxide - Earth Indicator
Key Takeaway:
The amount of carbon dioxide in Earth's atmosphere has increased sharply in the past 100 years as measured from the ground and from satellites. Since carbon dioxide is a greenhouse gas, this increase has warmed the planet.
Latest Measurement
429ppm
Latest Measurement Date
February 2026
Carbon dioxide (CO2) is an important greenhouse gas. Greenhouse gases trap the heat from sunlight, warming the planet. Without any greenhouse gases, Earth would be too cold to support life. But the more greenhouse gases there are in the atmosphere, the warmer the planet becomes.
Carbon dioxide comes from sources such as the burning of fossil fuels (such as coal, oil, and natural gas), wildfires, and volcanic eruptions. The graph shows atmospheric CO2 levels measured by NOAA at Mauna Loa Observatory, Hawaii, since 1958. It's important to note that “parts per million” refers to the number of carbon dioxide molecules per million molecules of dry air. The data shown are the latest available, updated monthly.
The second animated graph shows CO2 levels from an Antarctic ice core in combination with the observations from Mauna Loa Observatory. This extends the record back through Earth’s last three glacial cycles. The Antarctic ice core measures CO2 levels trapped in tiny air bubbles from the past that were preserved when the ice formed.
Ground-based and satellite measurements have measured a sharp increase in atmospheric CO2 in recent decades. With a more than 50% increase in CO2 since the start of industrial times in the 18th century, scientific measurements have linked this increase primarily to the burning of coal, oil, and gas. This means that CO2 levels are now 150% the value they were at in 1750 — this is at least 1.5 times greater than the natural increase observed at the end of the last ice age 20,000 years ago, which happened over thousands of years.
The animated map below shows the historical changes in global carbon dioxide over time. Note the colors change as the amount of CO2 rises from 365 parts per million (ppm) in 2002 to over 420 ppm in 2022. These measurements from the AIRS instrument come from the mid-troposphere, the layer of Earth's atmosphere that is 8 to 12 kilometers (about 5 to 7 miles) above the ground.
CO2 Through the Seasons
A closer look at the carbon dioxide measurements at Mauna Loa shows a series of wiggles in the data. Although total CO2 is increasing each year, there is also a short-term cycle visible within the larger trend.
Atmospheric CO2 Is Highest in the Spring, Lowest in Autumn
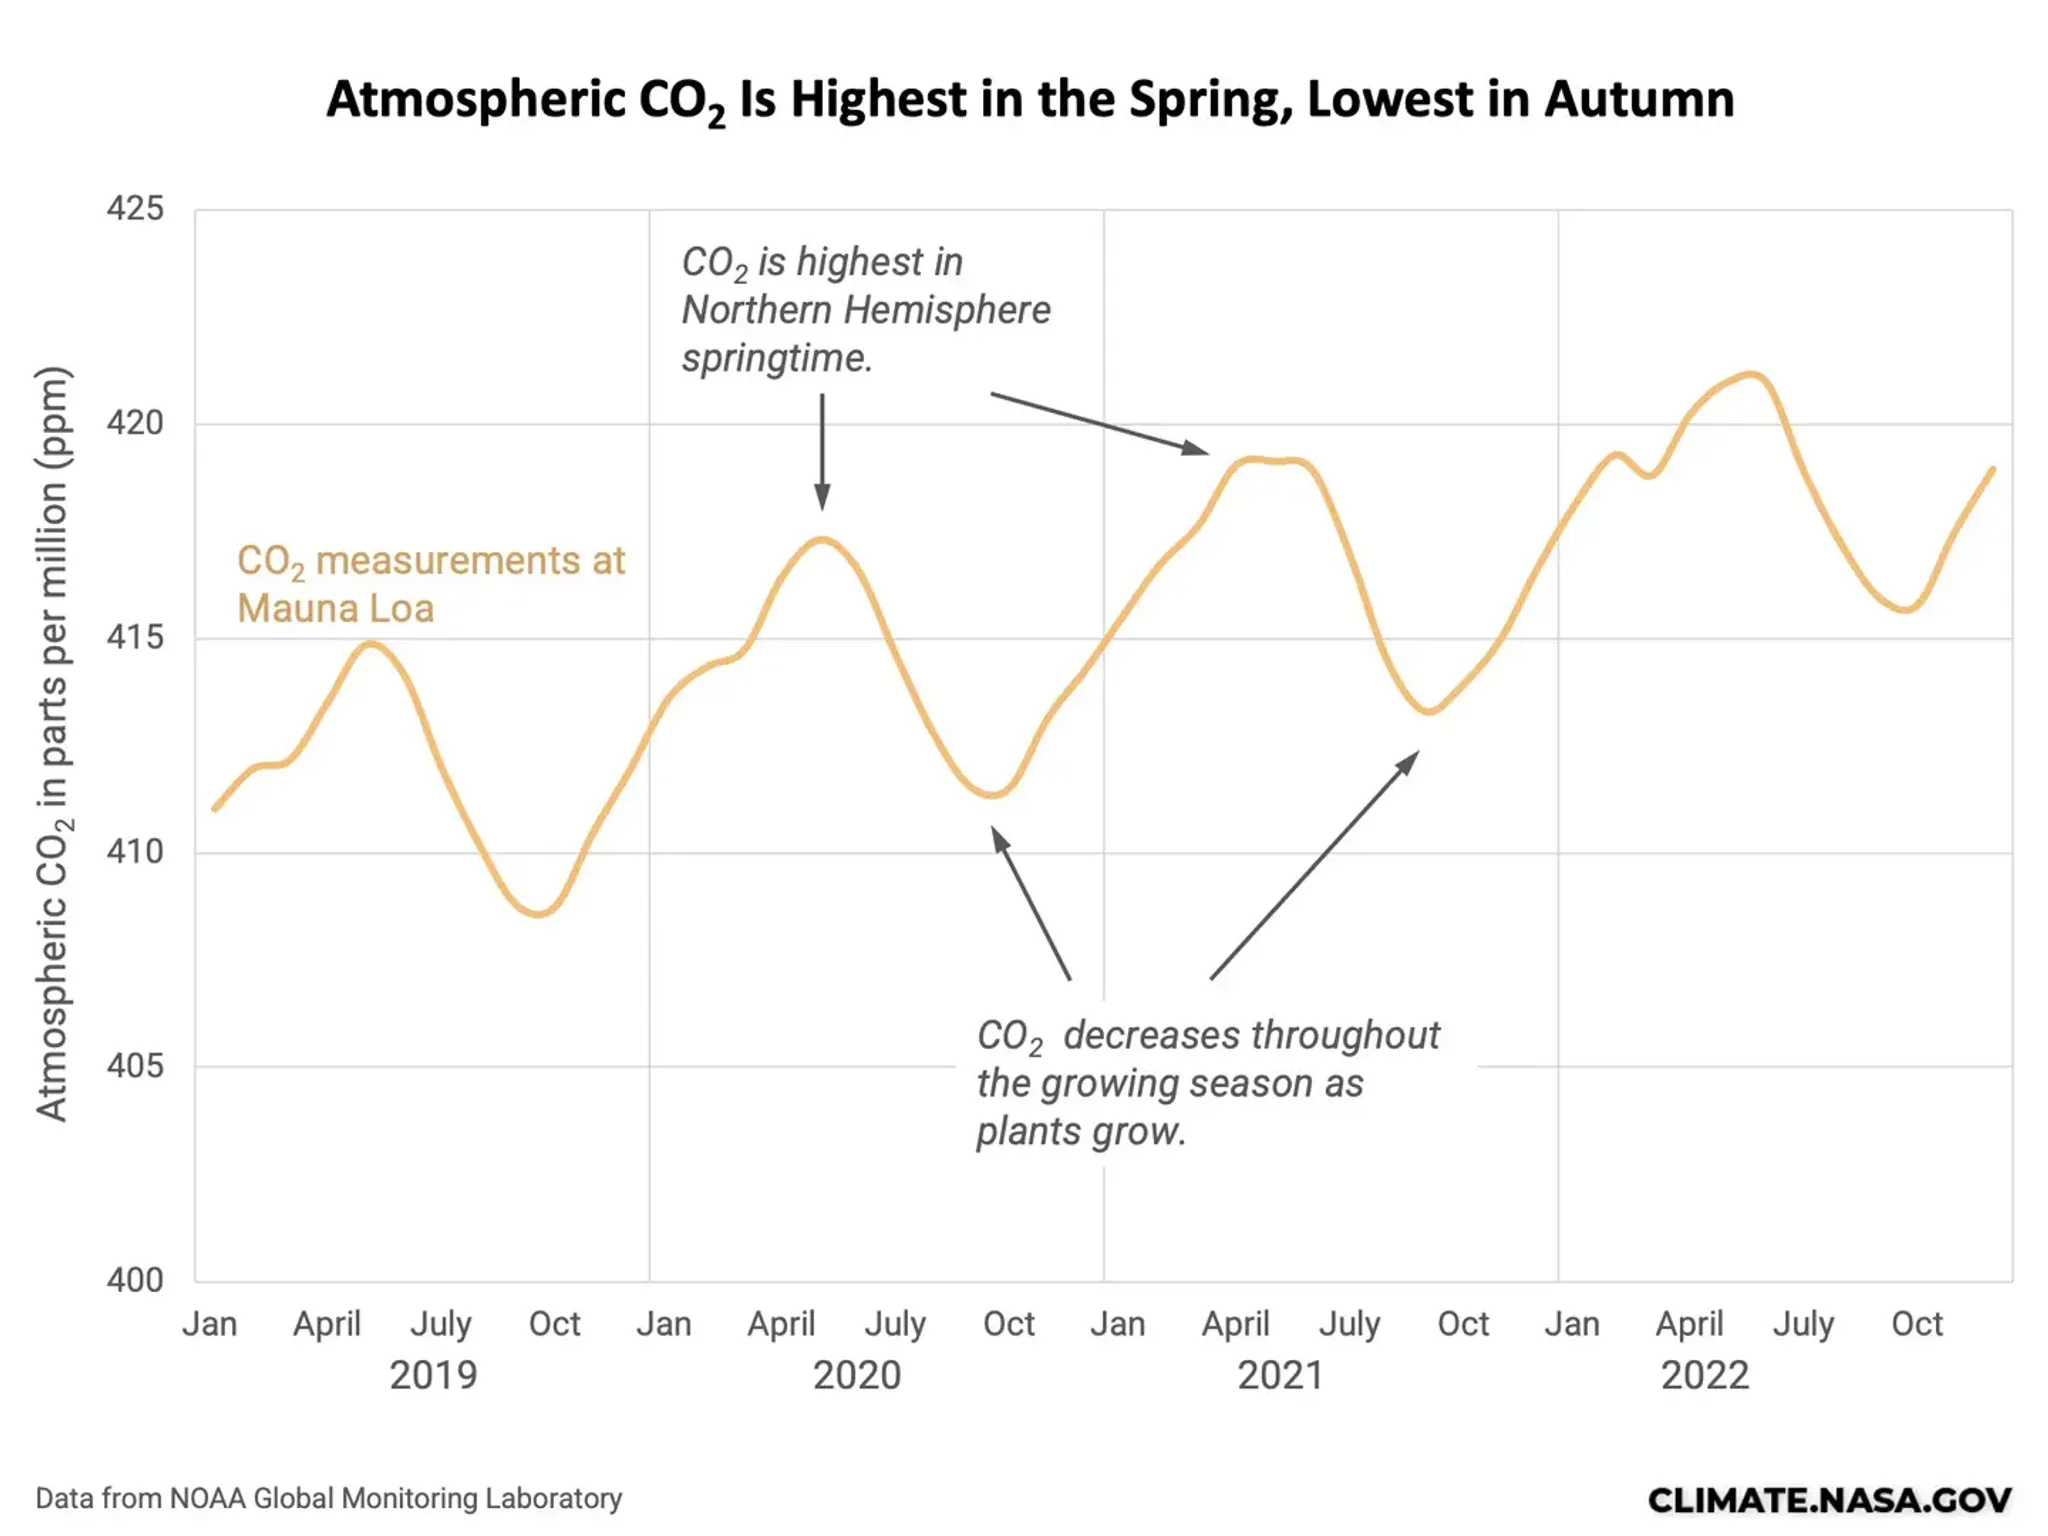
This annual rise and fall of CO2 levels is caused by seasonal cycles in photosynthesis on a global scale. In Northern Hemisphere spring, plants come to life and draw in CO2 to fuel their growth. This begins the process of lowering the amount of CO2 in the atmosphere. In northern autumn, plant growth stops or slows down, and the whole process reverses itself. Much of the plant matter decomposes, releasing CO2 back to the atmosphere.
A similar but less intense pattern repeats in the Southern Hemisphere in opposite seasons. Spring growth starts in September and winter decomposition begins in March, so CO2 records in the Southern Hemisphere show the opposite pattern of that seen in Mauna Loa. However, because there is a lot more land and vegetation in the Northern Hemisphere than the southern, the global yearly cycle more closely aligns with the northern seasons.
See the cycle in action in the visualization Watching Earth Breathe: The Seasonal Vegetation Cycle and Atmospheric Carbon Dioxide.
This cycle of plant growth gives the graph of CO2 a sawtooth pattern of ups and downs from year to year. At a larger scale, the upward climb of the trend line over the decades is caused by CO2 emissions, primarily from burning fossil fuels. Thus, the data illustrate both natural factors and human additions of CO2.
