In Brief:
The amount of CO2 in the atmosphere is measured at Mauna Loa Observatory, Hawaii, and all around the world. NASA also measures CO2 from space. Data from around the planet all shows the same upward trend.
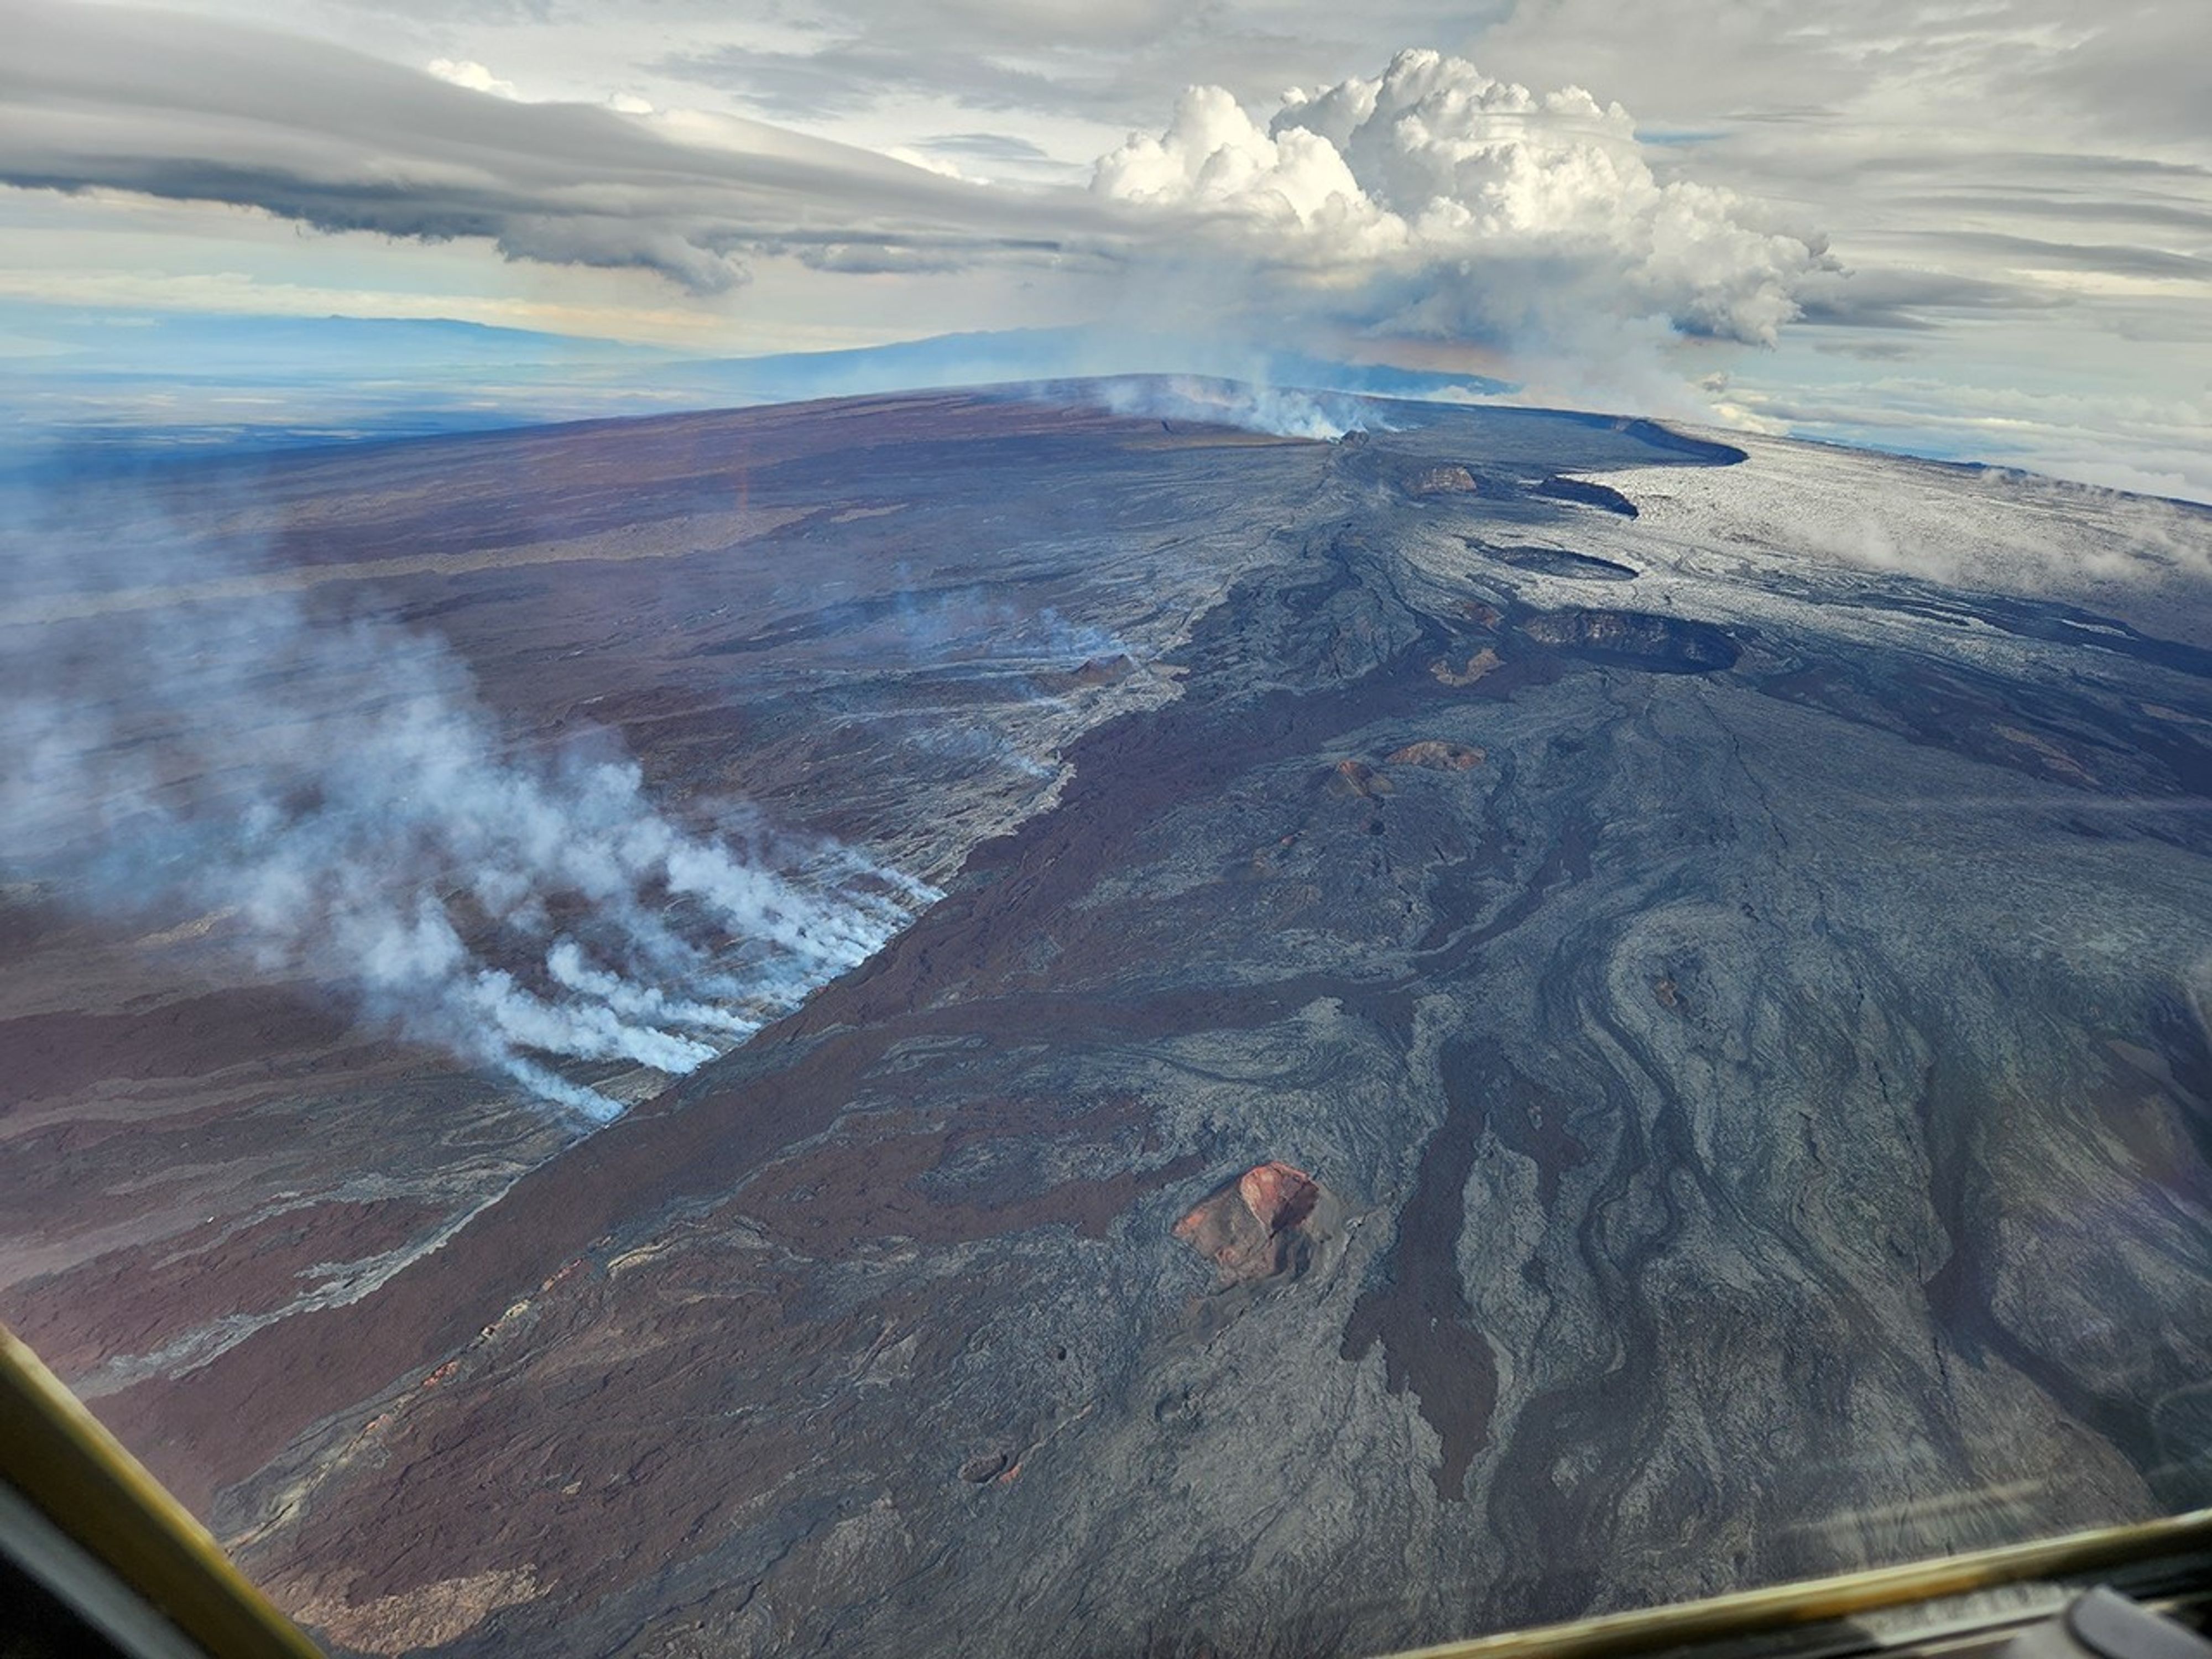
The longest record of direct measurements of carbon dioxide (CO2) in Earth’s atmosphere comes from Mauna Loa Observatory in Hawaii, operated by the National Oceanic and Atmospheric Administration. These measurements began in 1957 and continue today, painting a clear picture of how CO2 has been changing over the seasons, years, and decades.
Mauna Loa is an active volcano, though, so how can scientists be sure that the volcano itself is not the cause of rising CO2 measured there?
There are several answers to this question.
Mauna Loa Observatory sits in an isolated location so it can capture clean air flowing over the Pacific Ocean. There is little direct influence from pollution due to the vastness of the ocean, but there are some local, natural processes that can change the amount of CO2 over short amounts of time (such as a few hours). For instance, nearby plants and trees can temporarily draw CO2 out of the air through photosynthesis.
Gases from Mauna Loa’s crater, which is 4 miles (6 kilometers) away from the observatory, can temporarily raise the amount of CO2 in the air. Prevailing winds generally prevent volcanic gases from reaching the observatory, but when the wind is light, it can happen. However, the influx of volcanic CO2 is immediately noticeable because the readings jump upward sharply, and by amounts far larger than normal seasonal fluctuations. These brief spikes are not included in the final data because they’re caused by short-term, local variations, and they don’t reflect the long-term average that the observatory strives to measure.
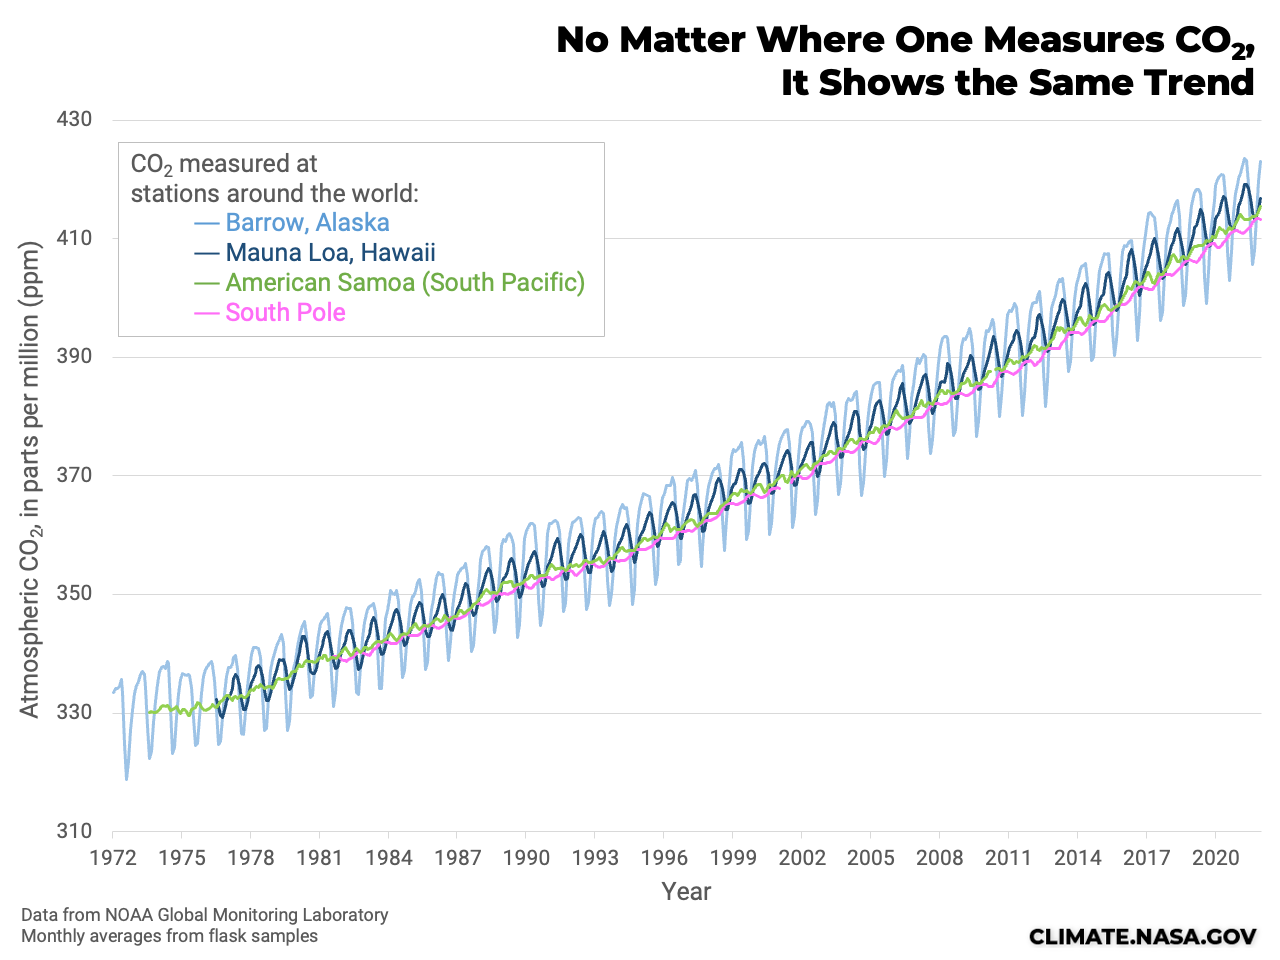
Another way to answer the question is to look at CO2 data from other parts of the world. If Mauna Loa data were contaminated by the volcano, then those measurements would look different from air samples collected in Alaska or at the South Pole. Air samples are regularly collected from observatories, tall towers, aircraft, and weather balloons at 86 locations worldwide. These data from around the planet all follow the same trend.
Lastly, NASA’s Orbiting Carbon Observatories, OCO-2 and OCO-3, were designed to measure CO2 from space. Instead of collecting samples from individual locations, these instruments use their lofty vantage points to make around 100,000 measurements around the world each day. Continuous global observations can see short-term changes in CO2 concentrations, and can be used to estimate CO2 emissions from cities and individual power plants. These missions also help scientists learn more about how carbon dioxide is stored and released by natural processes, which is important because the natural environment soaks up more than half of the CO2 that is emitted by human activities.
Accurate measurements of greenhouse gases are essential to our understanding of climate change, and the amount of CO2 in the atmosphere is measured by many different methods and all around the world. By using more than one approach, scientists can be sure they’re measuring a global trend, as well as local variations.
Read More
FAQ: What do volcanoes have to do with climate change?
Missions that Observe CO2
Atmospheric Infrared Sounder (AIRS)

