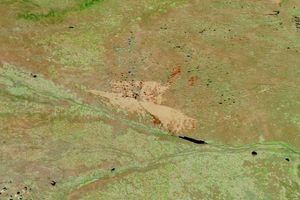
In November 2018, devastating fires raced through forests, shrublands, grasslands, farmland, and towns in California. One of them—the Camp Fire in Butte County—destroyed more than 10,000 homes and caused at least 63 deaths, making it the deadliest and most destructive fire on record in the state.
The health consequences extend well beyond the fire’s path. Millions of people living in Northern California have been breathing unhealthy air as smoke has lingered. The pall led to code red air quality alerts in many communities, canceled events, and school closures.
As wildfires consume wood, vegetation, homes, and other materials, they emit many gases and particles, including carbon monoxide, carbon dioxide, hydrocarbons, nitrogen oxides, organic carbon, and fine particulate matter (PM2.5). The PM2.5 —including a type of aerosol called black carbon—is especially harmful because the particles are small enough to enter the lungs and bloodstream. Health research links fine particle exposure to respiratory diseases, heart problems, and premature deaths.
The animation above shows plumes of black carbon from the Camp Fire streaming across Northern California, blanketing San Francisco, Sacramento, and several other communities. In the beginning of the animation, smoke from the Hill and Woolsey Fires in Southern California is also visible. Smoke lingers in the low-lying Central Valley because mountain ranges on either side set up temperature inversions that prevent winds from easily dispersing pollution.
The maps show black carbon data from the GEOS forward processing (GEOS-FP) model, which assimilates information from satellite, aircraft, and ground-based observing systems. To simulate black carbon, modelers make use of satellite observations of aerosols and fires. GEOS-FP also ingests meteorological data like air temperature, moisture, and winds to project the plume’s behavior.
GEOS FP, like other weather and climate models, uses mathematical equations that represent physical processes to calculate what is happening in the atmosphere. The model calculates the position and concentration of black carbon plumes at every hour. The model ingests new aerosol data at three hour intervals and new meteorological data at six hour intervals.
In the United States, 35 percent of black carbon emissions come from wildfires. Transportation is responsible for 52 percent, and the energy sector and industry sectors produce the rest.
References & Resources
- AirNow Current AQI. Accessed November 15, 2018.
- Environmental Protection Agency (2018) Black Carbon. Accessed November 15, 2018.
- NASA (2018) GMAO Data Products. Accessed November 15, 2018.
- The Conversation (2018, November 15) Fine particle air pollution is a public health emergency hiding in plain sight. Accessed November 15, 2018.
- The Sacramento Bee (2018, November 14) No easy breathing: The smoke in Sacramento hasnâÂÂt been this bad in nearly a decade. Accessed November 15, 2018.
- The Washington Post (2018, November 14) Californiaâs deadliest wildfire is also a massive air-quality problem. Accessed November 15, 2018.
- Wired (2018, November 14) Is California's Smoke Getting Worse? Itâ s Complicated. Accessed November 15, 2018.
- The San Francisco Chronicle (2018, November 14) This spell of smoky air is not the worst the Bay Area has ever seen. Accessed November 15, 2018.
NASA Earth Observatory images by Joshua Stevens, using GEOS data from the Global Modeling and Assimilation Office at NASA GSFC. Story by Adam Voiland, with information from Patricia Castellanos and Anton Darmenov.