


Editor’s Note: This story is the third part in a series. Please read part 1, part 2, and part 4 for a more complete picture of Amazon deforestation.
Scientists have used satellites to track the deforestation of the Amazon rainforest for several decades — enough time to see some remarkable shifts in the pace and location of clearing.
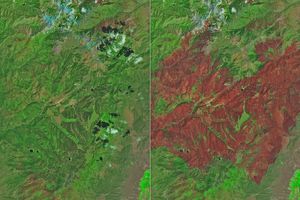
During the 1990s and 2000s, the Brazilian rainforest was sometimes losing more than 20,000 square kilometers (8,000 square miles) per year, an area nearly the size of New Jersey. “It was open season on the rainforest back then,” said Michael Coe, a senior scientist with the Woods Hole Research Center. “Ranchers, soy farmers, land speculators, loggers, and miners were coming to the frontier and clearing virtually anything they wanted.”
In 2004, following several years of particularly rapid deforestation, public pressure turned the tide. That was the year the Brazilian government adopted an aggressive policy called the Action Plan for the Prevention and Control of Deforestation in the Legal Amazon (PPCDAm). The government created a large network of national and state parks, established protected territories for indigenous groups, strengthened environmental enforcement agencies, made it more difficult to export goods produced on illegally deforested land, and strengthened satellite monitoring systems.
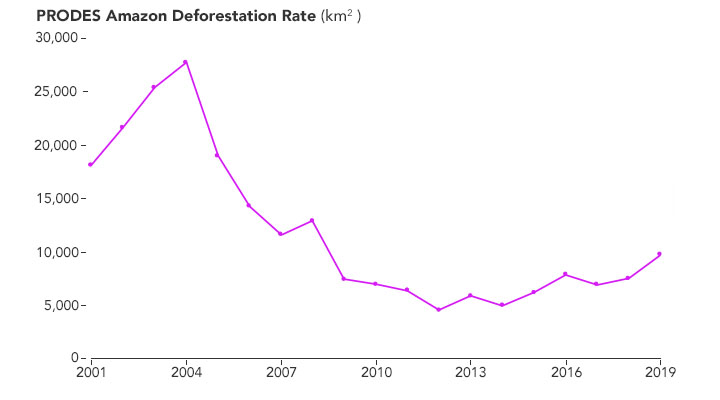
It was ambitious, and it worked. Within a few years, large-scale deforestation dropped by roughly 50 percent. By 2012, forest clearing was down nearly 80 percent, or roughly 5,000 square kilometers (1,900 square miles) per year. The turnaround was heralded as one of the world’s most dramatic environmental success stories.
Satellite-based forest monitoring systems played a key role in slowing deforestation, explained Raoni Rajão, an expert in environmental policy at Federal University of Minas Gerais. In 1998, the government established a data-collection system called PRODES, based on Landsat 5 and 7 observations. Scientists at Brazil’s national space agency (INPE) used that data to calculate how much rainforest was being clear-cut each year in the Legal Amazon.
For more than a decade, PRODES data was mostly kept within government labs and agencies. In 2002, with public outrage about deforestation growing, INPE began posting the full dataset online, complete with deforestation maps for all of the Brazilian rainforest. “That move toward transparency and accountability proved crucial because it made it possible for the science community, NGOs, and the public to engage,” said Rajão.

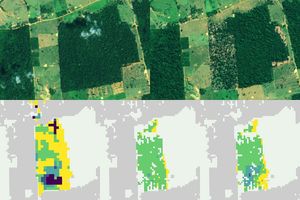
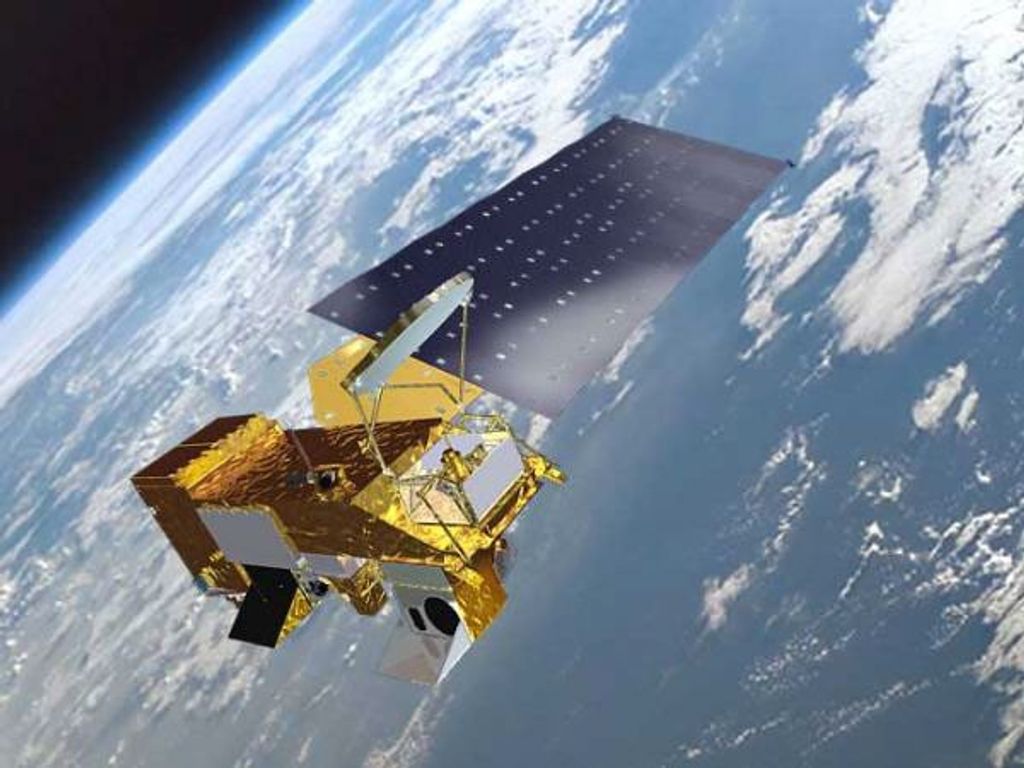
A second satellite-based system, DETER, went into operation in 2004 and further advanced the cause. While PRODES collected Landsat images once every few weeks and deforestation totals were updated once per year, DETER made use of daily observations of deforestation, fire, and vegetation health from lower-resolution sensors (MODIS) on NASA’s Terra and Aqua satellites. Though the image quality was lower, the daily coverage allowed forest monitors to identify some newly cleared areas in near-real time. When DETER was first set up, it sent deforestation alerts to enforcement officers within two weeks. By 2011, the system was sending alerts within a day.
“DETER completely changed the way rangers went about enforcement work,” said Rajão. Rather than doing random patrols and checking for permits, rangers would send squads of enforcement officers — with satellite images in hand — to investigate areas of recent, suspicious activity. That made it much easier to remove or apprehend equipment. The word spread among deforesters. The existence of DETER meant that environmental authorities would likely notice if large tracts of land were cleared, and fines and agents would follow soon enough.
Early in his career, NASA forest ecologist Doug Morton spent several years working with Brazilian colleagues to develop DETER. In those days, there were plenty of technical challenges to overcome. “With a system that looked over such a large area, we had to be very careful to avoid false detections,” Morton explained. “We learned we had to be quite conservative with the deforestation alerts.”
For instance, even though MODIS could detect subtle shifts in vegetation as soon as loggers started to remove some trees, the system did not flag something as deforestation until it had been fully cleared and burned, which was sometimes months later. And due to the resolution of MODIS, the system only detected relatively large clearings — those that were at least 25 hectares (62 acres).
Prior to DETER, clearings that were hundreds or even thousands of hectares were common along deforestation frontiers in Pará, Mato Grosso, and other states. After DETER was launched, the average size of patches began to decline. Within five years, the largest clearings virtually ceased. “The big players saw the writing on the wall and either changed their behavior or shifted their operations out of the rainforest and into the Cerrado,” said Coe, referring to the drier, savanna-woodland vegetation areas to the south and east of the rainforest.
“The trend toward smaller patch size is something that we now see all over the Amazon,” added Benjamin Jakimow, a Humboldt University researcher. “It is likely partly a strategy to avoid satellite monitoring and enforcement.”
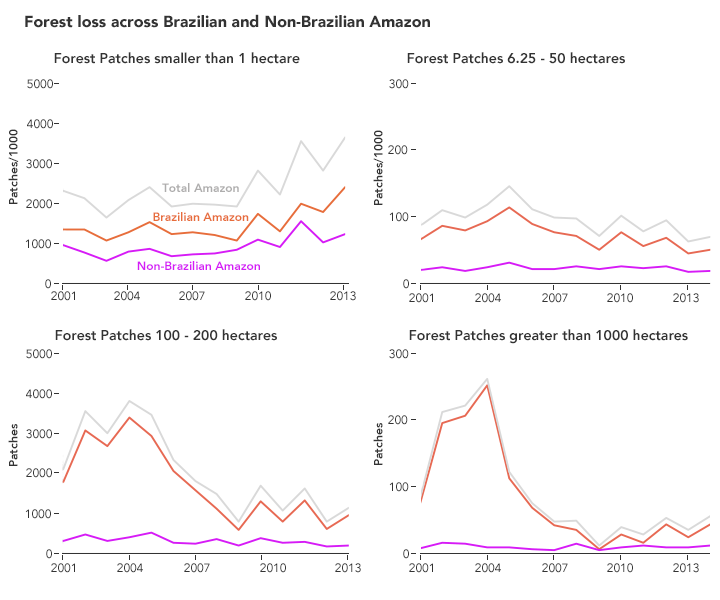
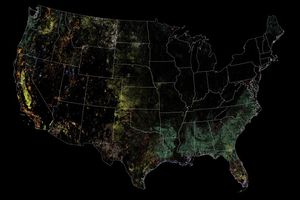
University of Leeds scientist Michelle Kalamandeen has been watching the smaller clearings closely using forest change data from the University of Maryland. In one recent analysis of Landsat observations, she found that the number of new large clearings (greater than 50 hectares) in the Amazon declined by 46 percent between 2001-2007 and 2008-2014, while the number of small clearings (less than 1 hectare) had increased by 34 percent. Most of the newer deforestation patches were below the threshold detected by DETER (less than 25 hectares).
Kalamandeen has also tracked basin-wide shifts in deforestation. Notably, hotspots of forest loss moved away from large soy farms in Mato Grosso and Pará and shifted north and east, into drier Cerrado areas in other Brazilian states and in Bolivia. Changing global demand and prices for soy, leather, and beef contributed to the migration, but analysts also attribute the shift to initiatives like the Soy Moratorium, which sought to keep products from recently deforested areas out of global markets.
NASA Earth Observatory images by Lauren Dauphin, using Landsat data from the U.S. Geological Survey, MODIS data from NASA EOSDIS/LANCE and GIBS/Worldview and forest loss data from the University of Maryland. Forest patch size chart uses data from Kalamandeen, Michelle, et al. (2018). PRODES deforestation rate data from INPE. Story by Adam Voiland.