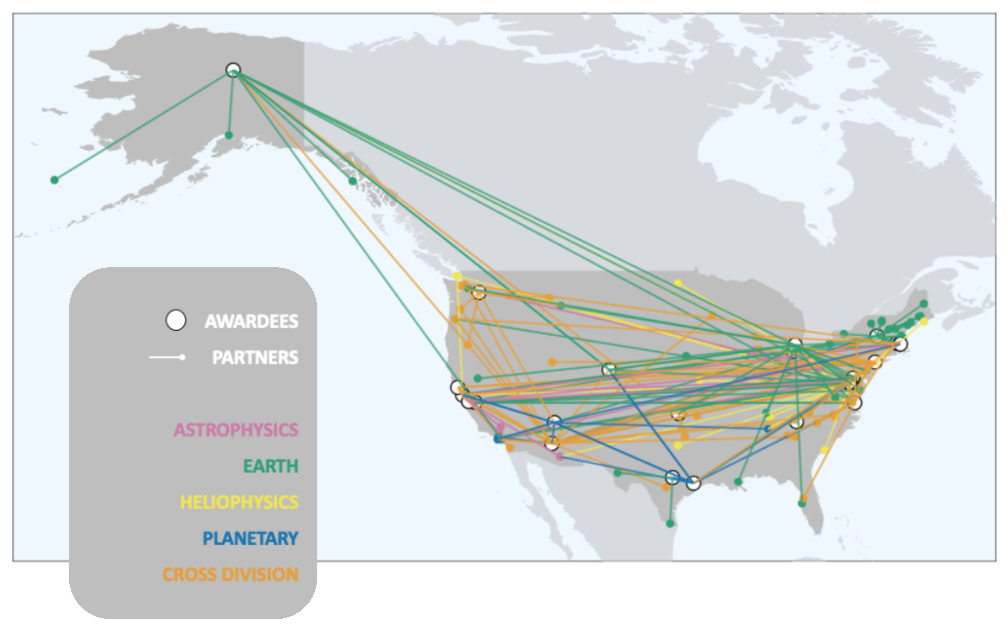


Science Activation Reach Map
The Science Activation program reaches learners in all 50 states and beyond. This map shows the locations across the US where learner interactions occurred in 2024. Through a network of networks, and thanks to the total solar eclipse, SciAct connected with at least 38% of all US zip codes* and 76% of US counties. Those counties reached contain 97% of US population. Each symbol represents a project. Explore our full interactive Reach Map for details.
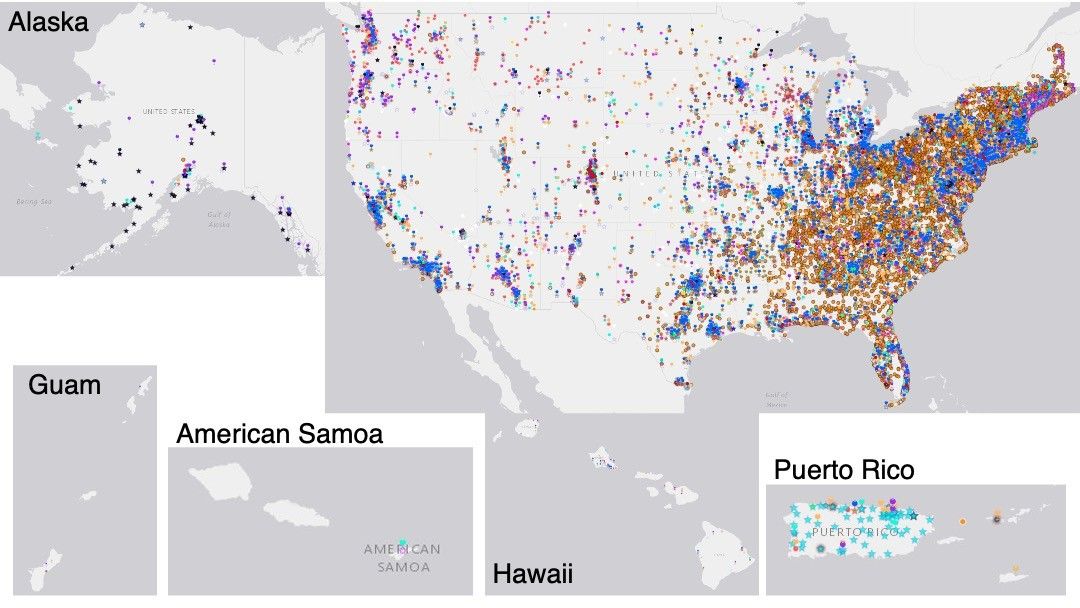
*Zip code data not available for all programs
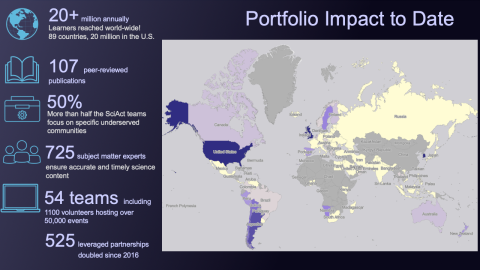
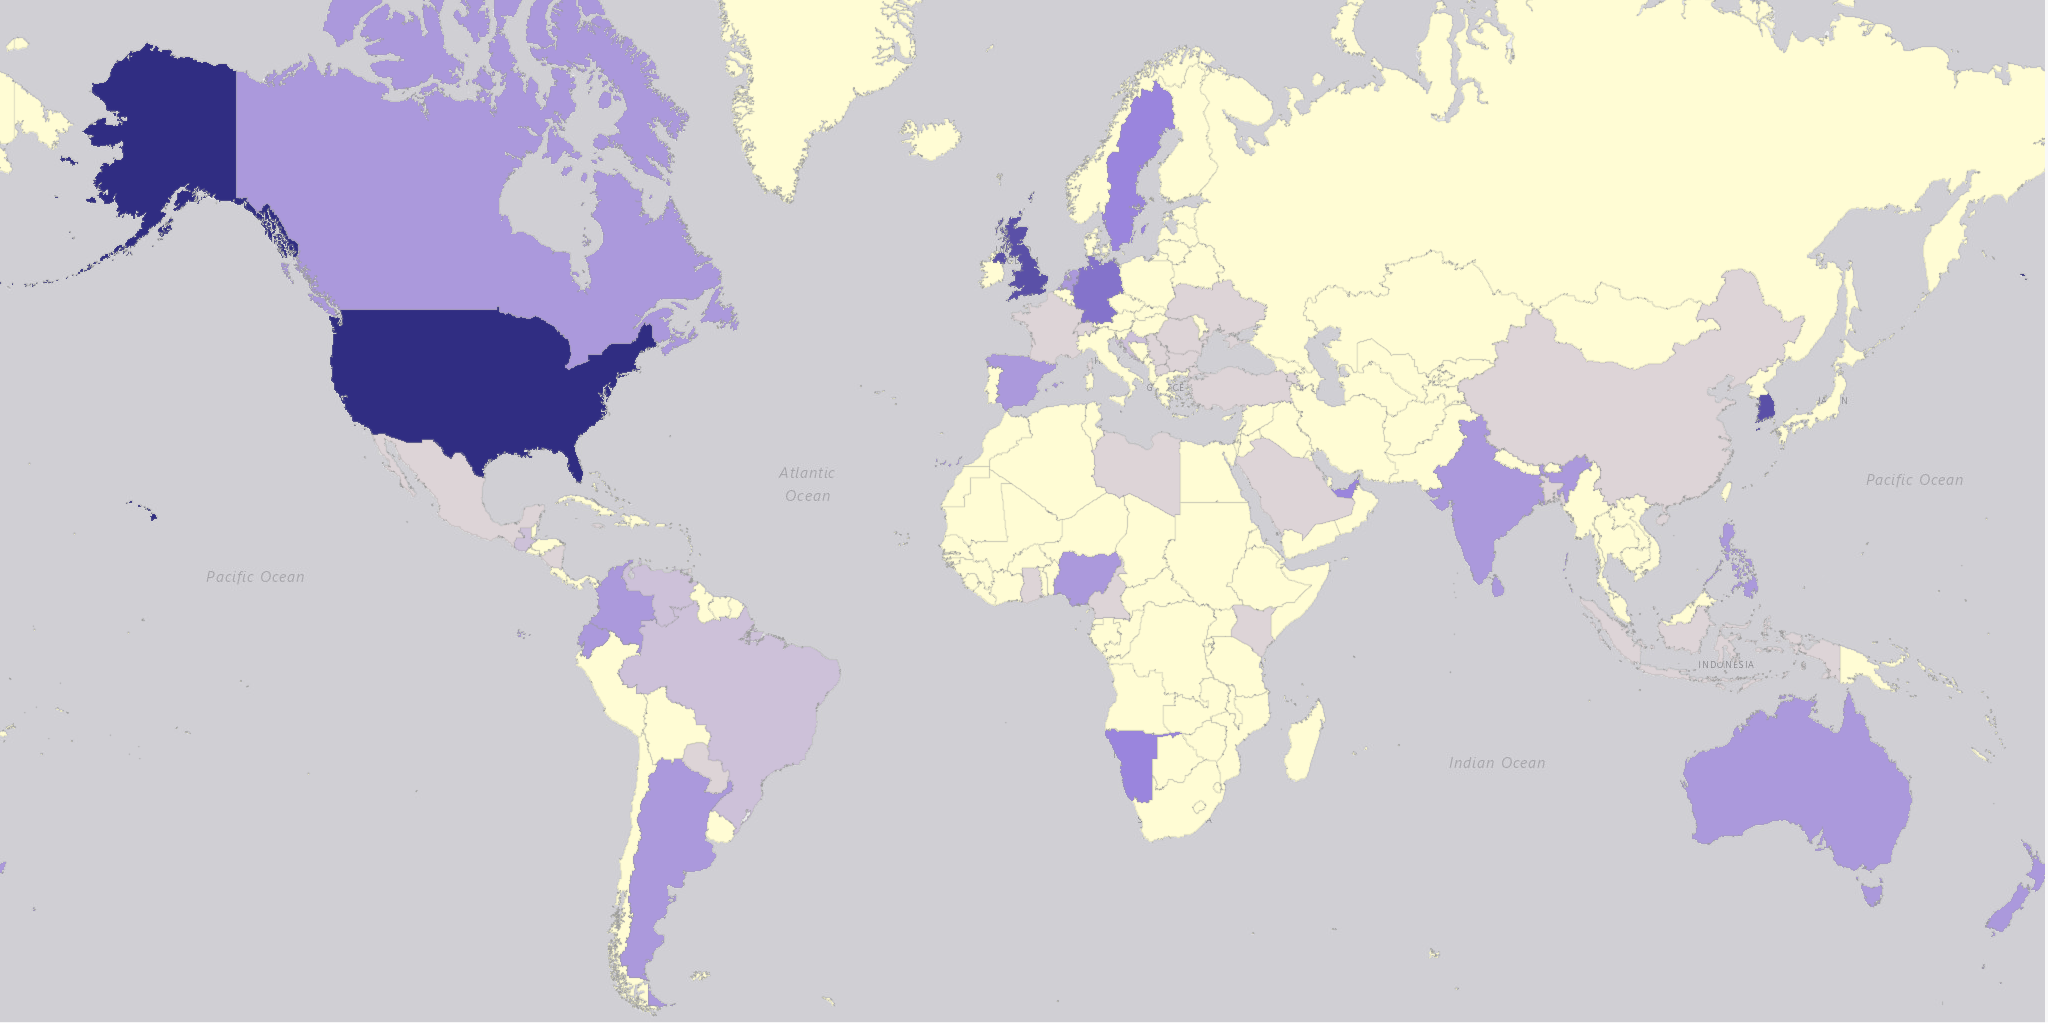
Science Activation has reached 171 Countries Across the Globe
The programs and resources of SciAct have reached 171 countries globally in since the program began in 2016. The map below shows global reach in 2024, which was strongly focused on the US because of the keen interest in the April total solar eclipse.
Interactions continue to grow
In 2024, Science Activation achieved with more than 119 million learner interactions in the US and globally*. This represents a continued substantial increase in year over year reach, which is attributed to the April 2024 total solar eclipse, as well as strengthened engagement with SciAct’s community-based partners across the United States.
2019 | 2020 | 2021 | 2022 | 2023 | 2024 | |
Learning interactions (global) | 15M | 23M | 21M | 52M | 76 M | 119 M |
Learning interactions (US) | 14M | 22M | 20M | 52M | 65 M | 116M |
Countries reached | 114 | 112 | 89 | 153 | 171 | 171 |
*Learner interactions do not necessarily represent unique learners.