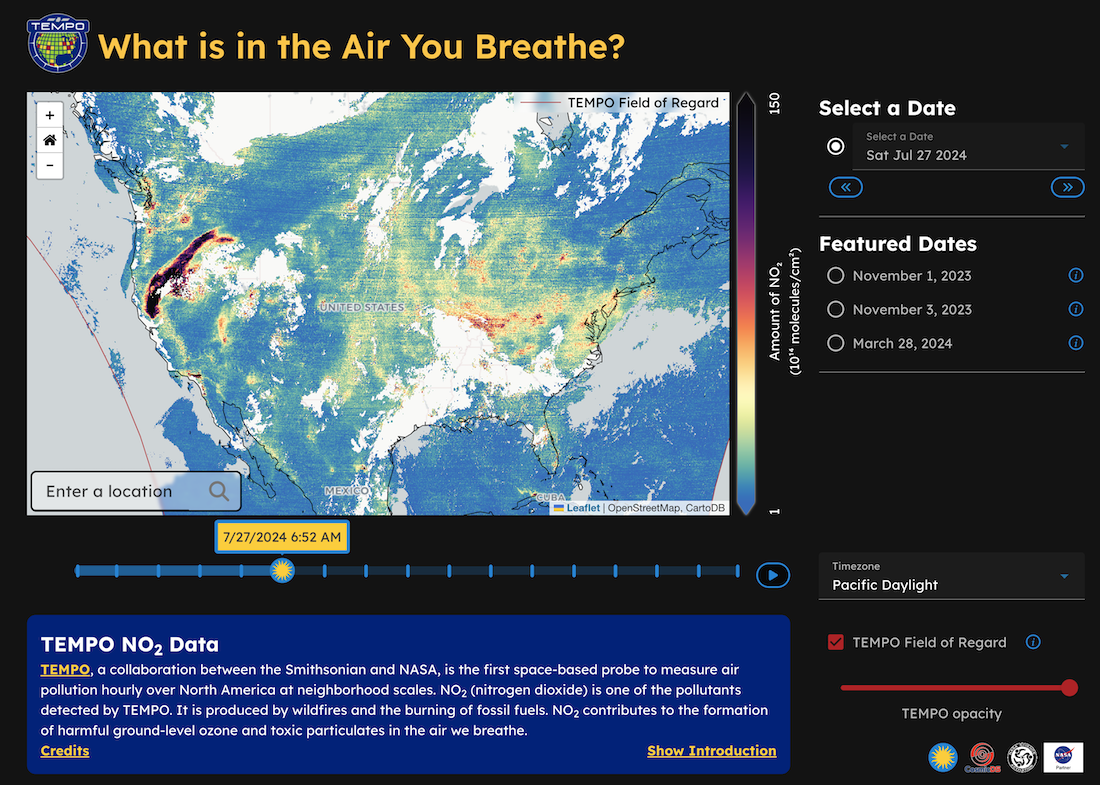


On May 30th, 2024, NASA and the Center for Astrophysics | Harvard & Smithsonian announced the public release of "high-quality, near real-time air quality data" from NASA’s TEMPO (Tropospheric Emissions: Monitoring of Pollution) mission. The NASA Science Activation program's Cosmic Data Stories team, led by Harvard University in Cambridge, MA, has since released a new "Data Story" – an interactive, digital showcase of new science imagery, including ideas for exploration and scientific highlights shared in a brief video and narrative text – that provides a quick and easy way for the public to visualize this important, large data set from TEMPO.
TEMPO allows unprecedented monitoring of air quality down to neighborhood scales, with its hourly daytime scans over North America. Air pollutants like NO2, produced, for example, by the burning of fossil fuels, can trigger significant health issues, especially among people with pre-existing illnesses such as asthma. The interactive views in the TEMPO Data Story provide public access to the same authentic data that scientists use and invite the public to explore patterns in their local air quality. For example, how do NO2 emissions vary in our area throughout the day and week? What are possible sources of NO2 in our community? How does our air quality compare with that of other communities with similar population densities, or with nearby urban or rural communities? TEMPO’s hyper-localized data will allow communities to make informed decisions and take action to improve their air quality.
The Cosmic Data Story team is grateful to TEMPO scientists, Xiong Liu and Caroline Nowlan, for providing the team with early access to the data and guidance on NO2 phenomena that learners can explore in the data. The TEMPO Data Story, featured on TEMPO’s webpage for the public, adds Earth science data to the portfolio of Cosmic Data Stories that is already making astrophysics data accessible to the public.
TEMPO Team Atmospheric Physicist from the Harvard-Smithsonian Center for Astrophysics, Caroline Nowlan, had this to say: "TEMPO produces data that are really useful for scientists, but are also important for the general public and policy makers. We are thrilled that the Cosmic Data Stories team has made a tool that allows everyone to explore TEMPO data and learn about pollution across North America and in their own communities."
The Cosmic Data Stories project is supported by NASA under cooperative agreement award number 80NSSC21M0002 and is part of NASA’s Science Activation Portfolio. Learn more about how Science Activation connects NASA science experts, real content, and experiences with community leaders to do science in ways that activate minds and promote deeper understanding of our world and beyond: https://science.nasa.gov/learn