


Tropospheric Composition
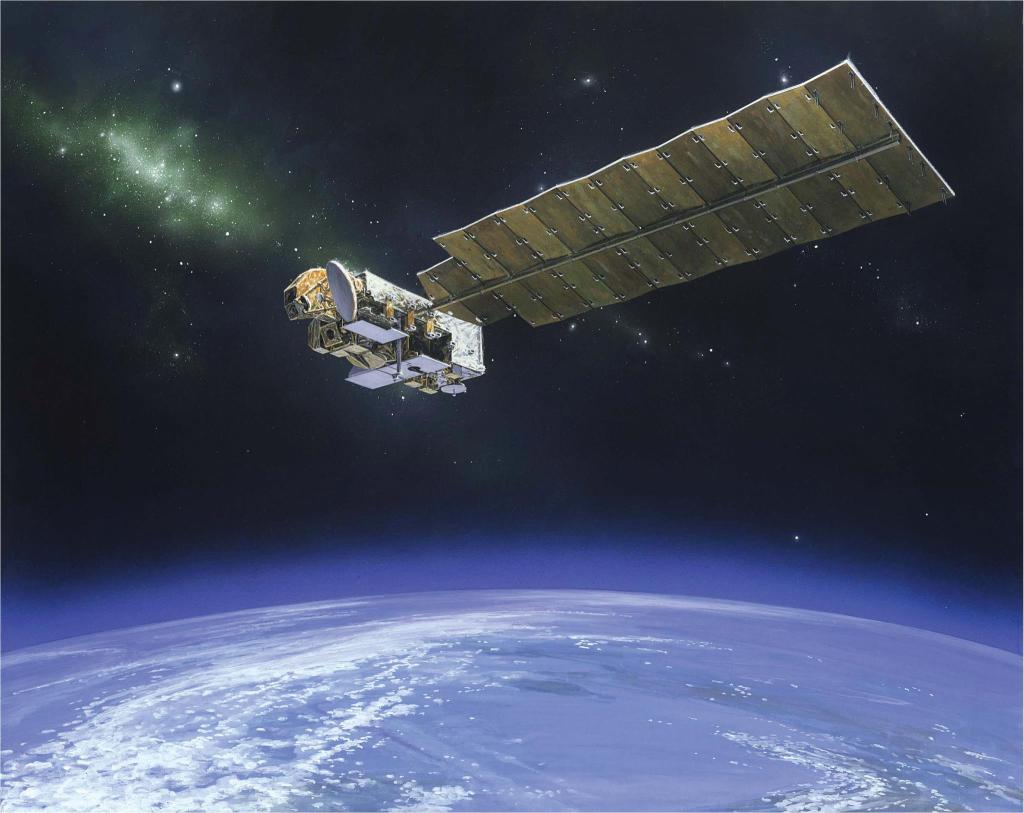
Aura focuses on one of the most vital resources on our planet, the air we breathe. Aura data help NASA scientists track the sources and concentrations of trace gases and their movement through the atmosphere.
Tropospheric Constituents Observed from Space
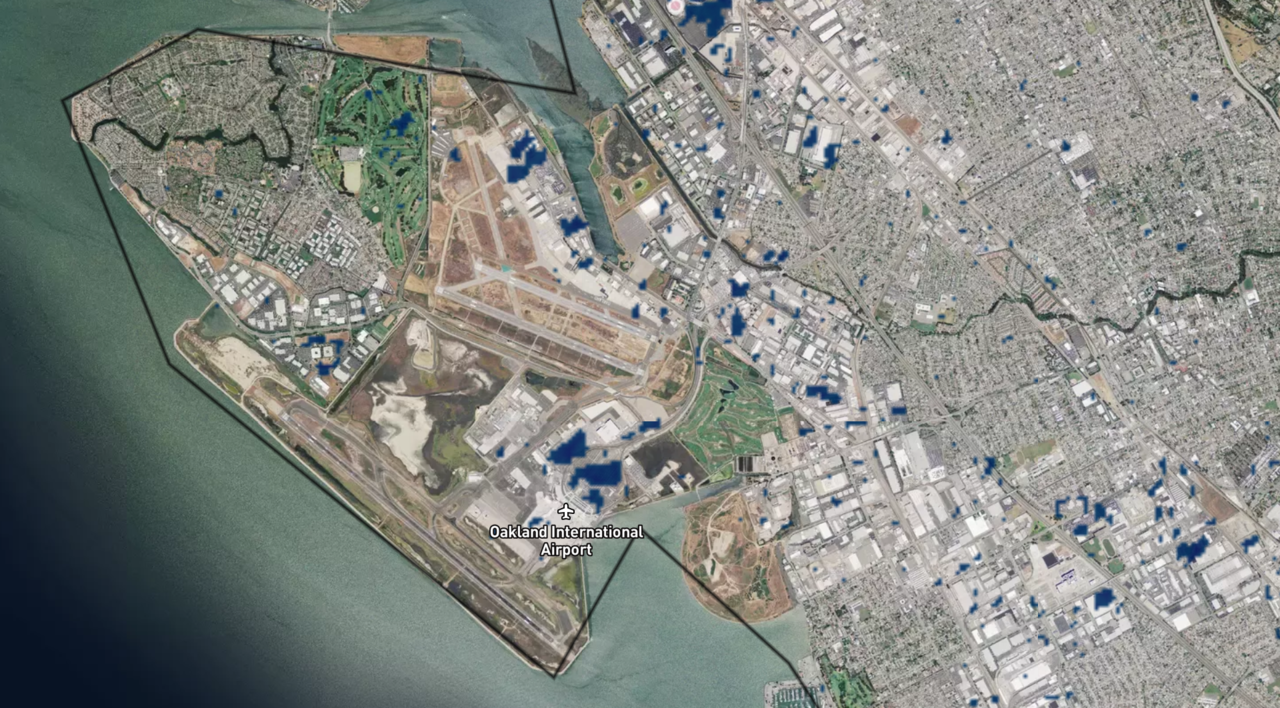
Nitrogen Dioxide
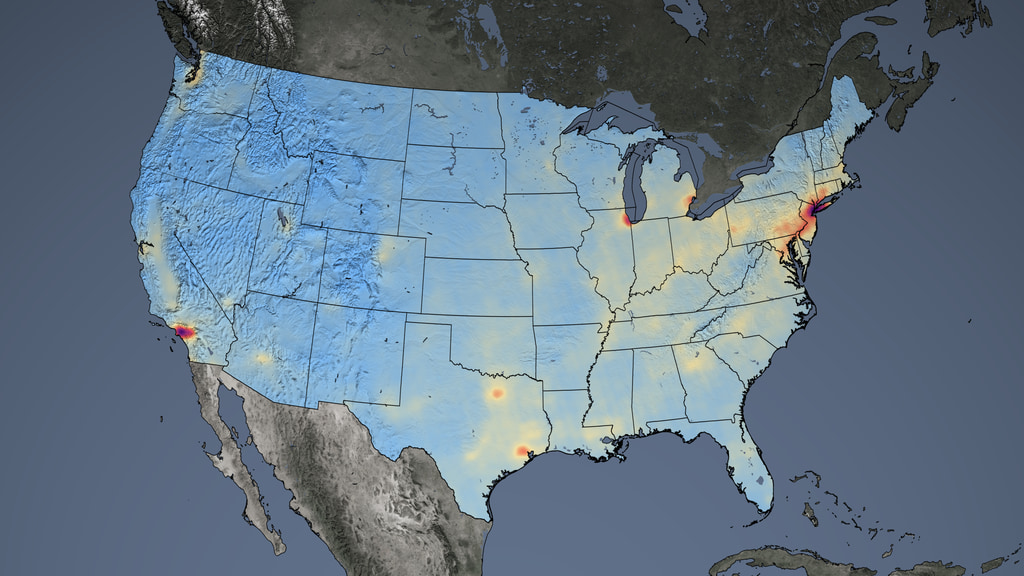
One of the atmospheric gases the instrument detects is nitrogen dioxide, which is a gas that is a common emission from cars, power plants and industrial activity. It is unhealthy to breathe and can quickly transform into ground-level ozone, a major respiratory irritant. Nitrogen dioxide hotspots occur over most major cities.
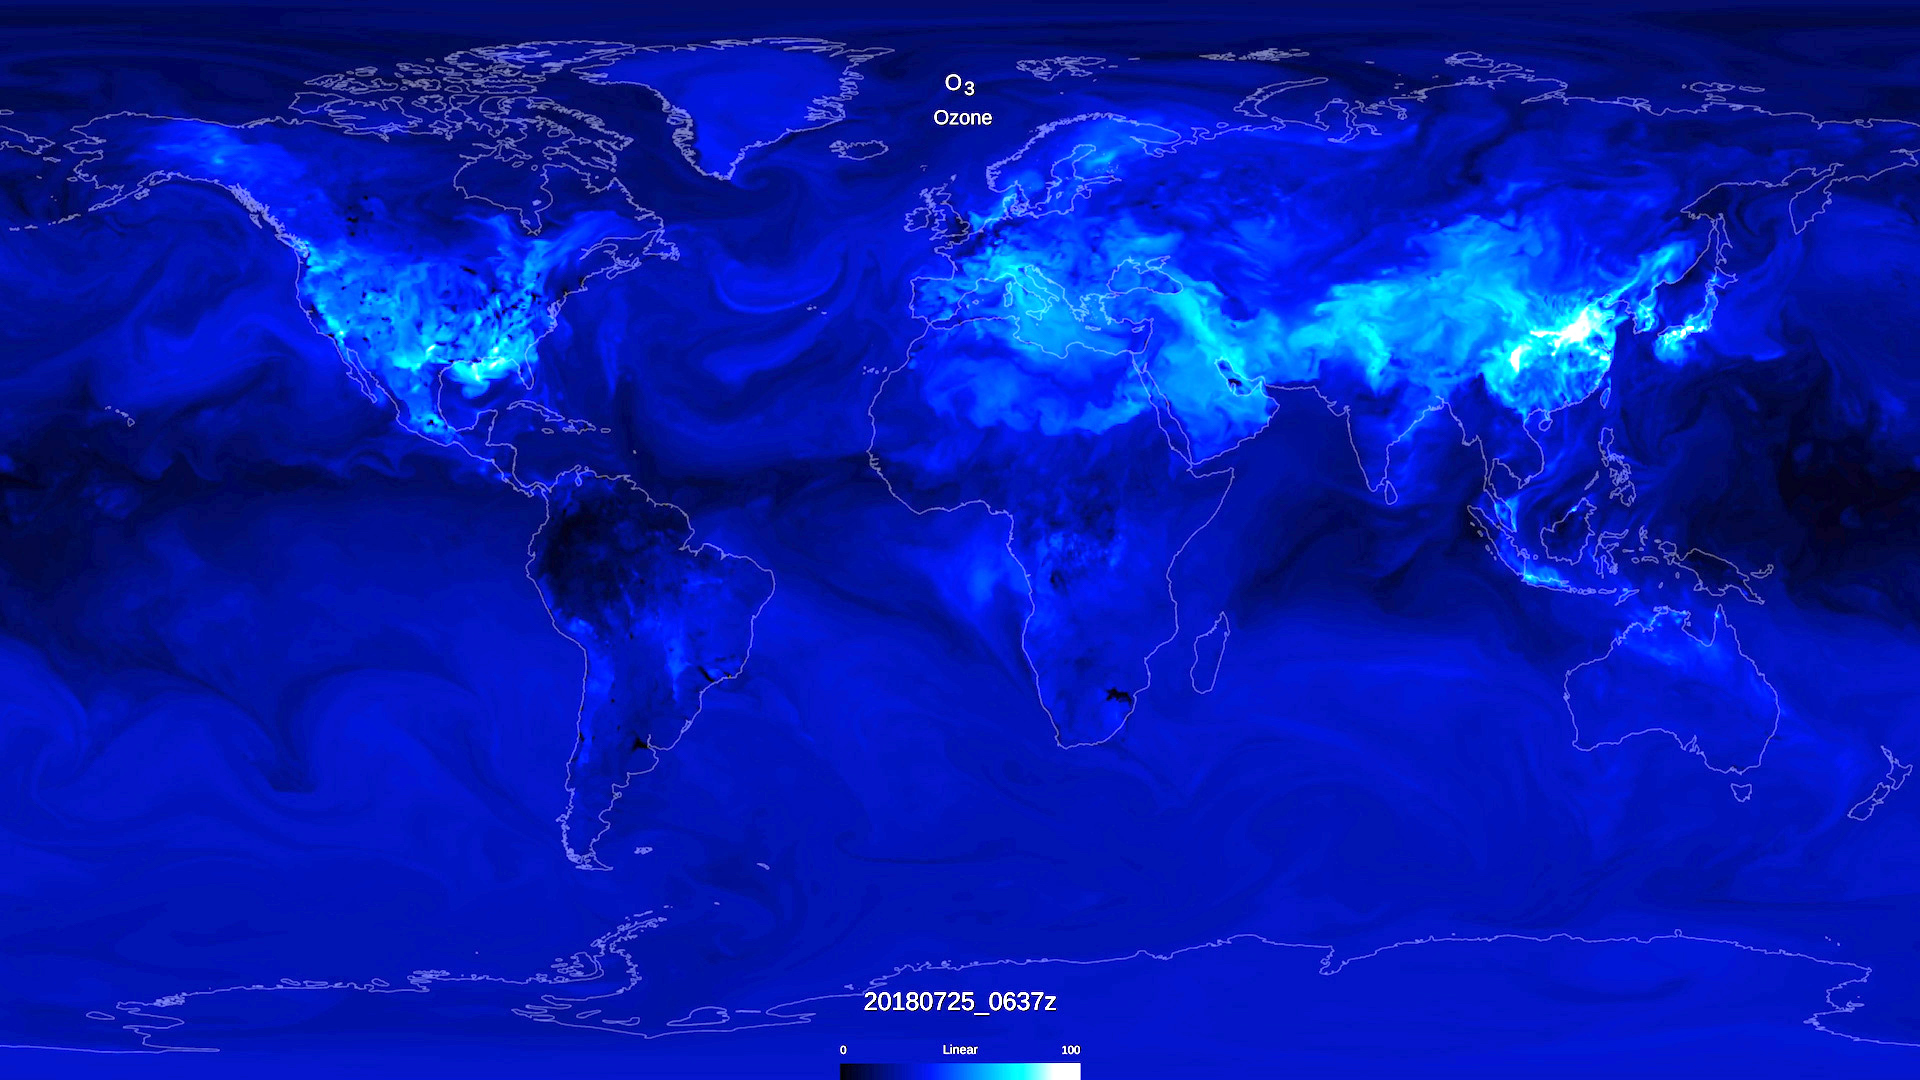
Surface-Level Ozone
At Earth’s surface, ozone is unhealthy to breath and it is not directly emitted into the air, but instead it is formed through chemical reactions in the atmosphere when ultraviolet (UV) radiation from the sun interacts with nitrogen oxides and volatile organic compounds (VOCs). Surface ozone is not to be confused with the stratospheric “ozone layer” which filters out most harmful UV rays from the sun.
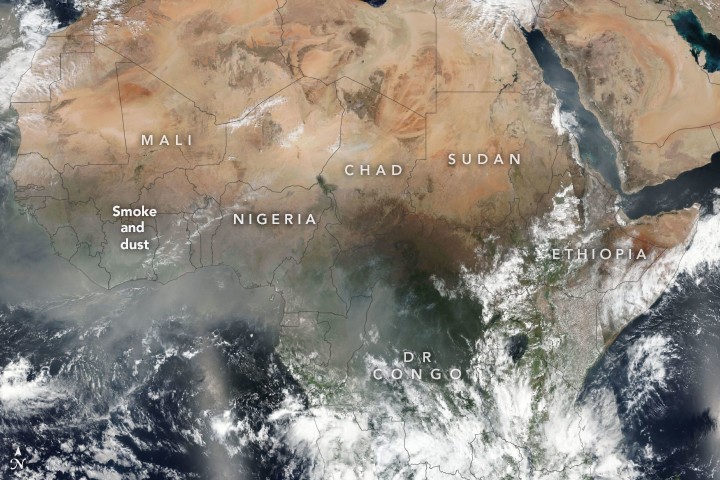
Particulate Matter
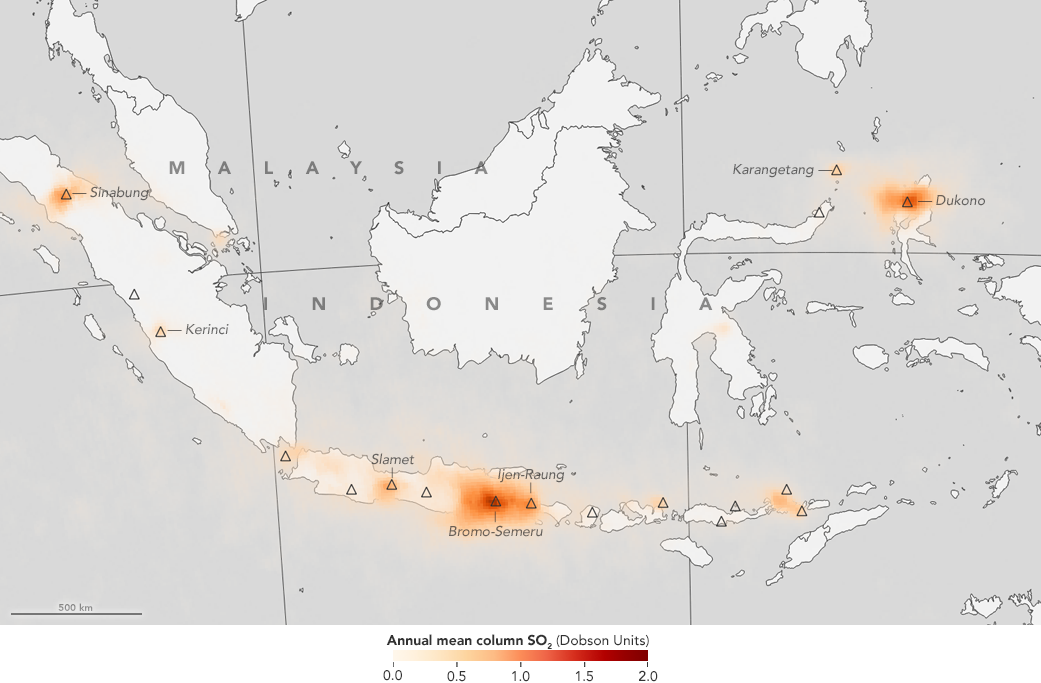
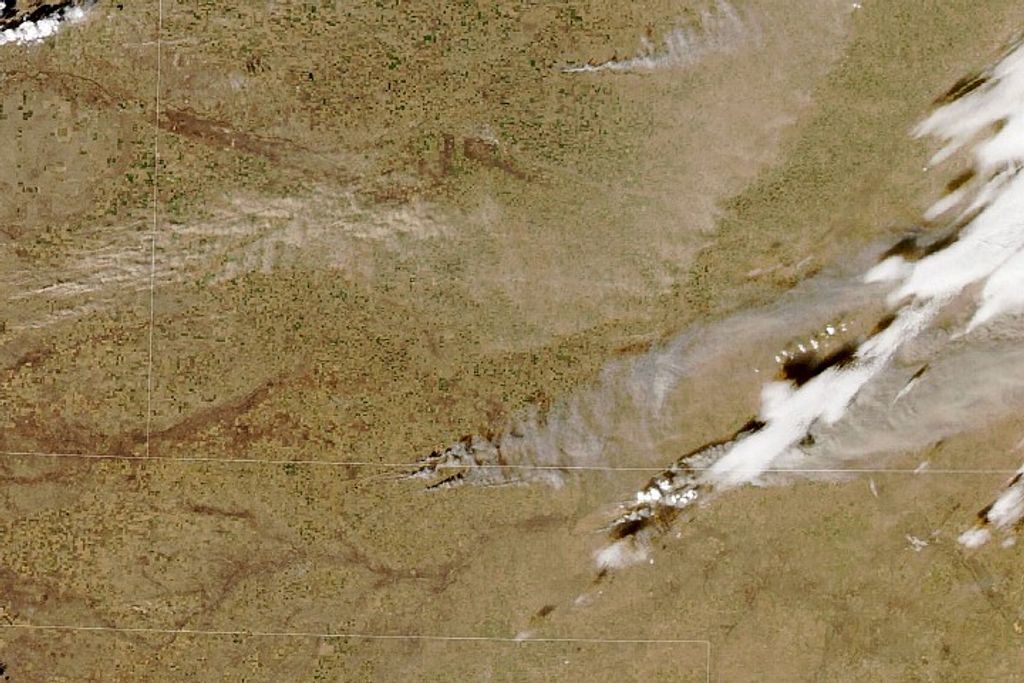
Particulate Matter (PM) are tiny particles (e.g., smoke and dust) that cause numerous health issues when breathed in. Aura is monitoring real time transport of smoke from fires, volcanic plumes and dust storms at local, regional and global scales.
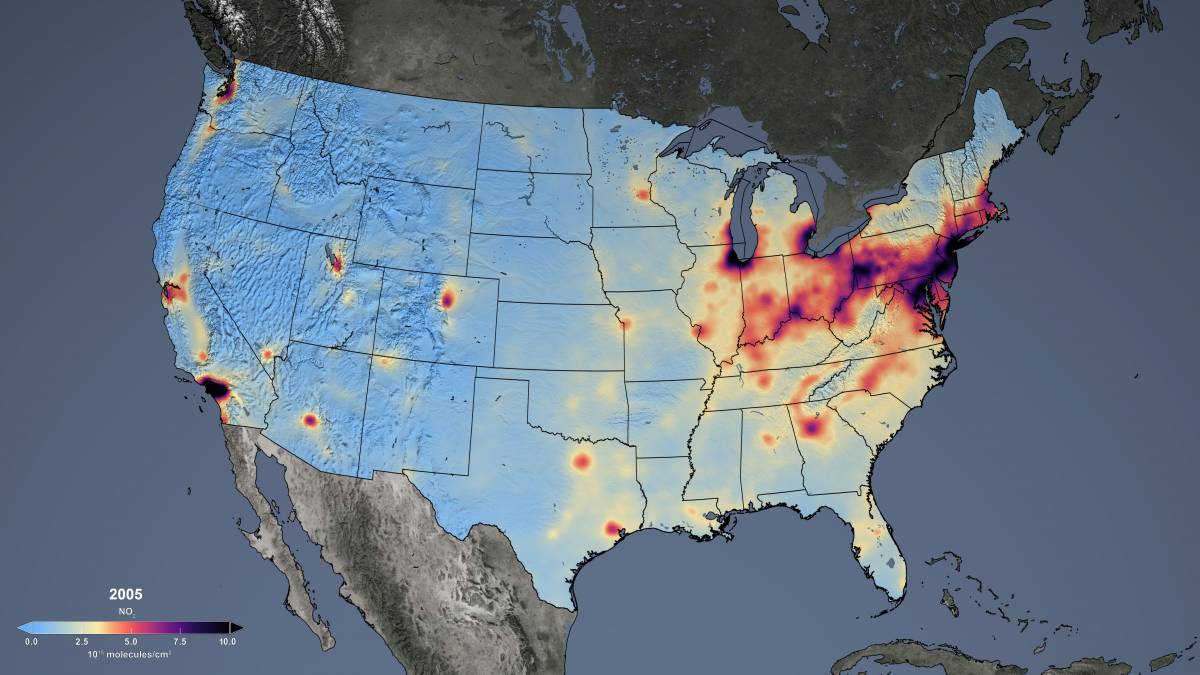
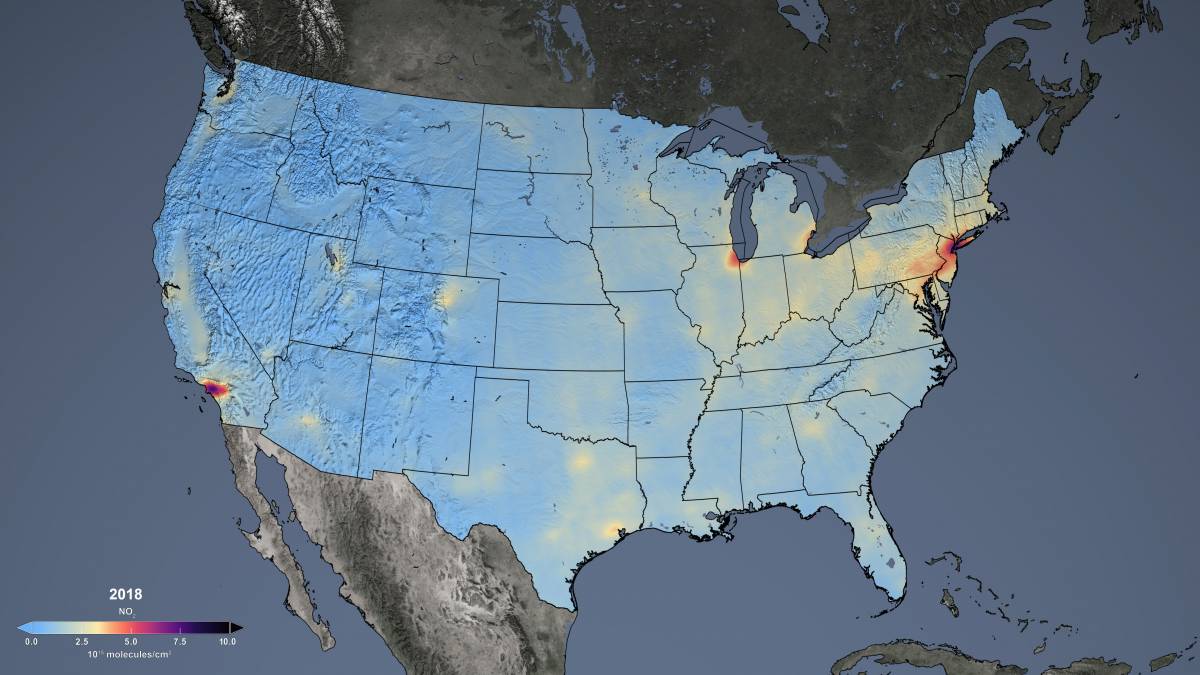


Before and After
Changes in Annual-average of Nitrogen dioxide
2005 - 2018
Downloads
Image 1 title
Human Health Impacts
Unhealthy air is responsible for an estimated 4 million premature deaths annually. Exposure to fine particulate matter (PM) causes and/or exacerbates health issues such as respiratory disease, ischemic heart disease, chronic obstructive pulmonary disease, lung cancer and stroke. When breathed in, ozone chemically reacts with lung tissue, causing respiratory issues (e.g., shortness of breath, coughing, and aggravation of asthma) and injury to lung tissue that accumulates over time with continued exposure. Nitrogen dioxide also causes respiratory issues and is associated with, for instance, new cases of asthma among children.
Aura datasets are used to identify wildfire locations, assess burned area, track smoke transport, issue air quality alerts, and estimate health effects. Aura data gives scientific evidence that government initiatives such as the Clean Air Act and the Montreal Protocol significantly helped improve the air quality.
Impacts on Agriculture
One issue that is often overlooked is the negative effects of trace gases on crops. Surface-level ozone, at elevated concentrations can seriously affect overall plant health and reduce crop yields. The economic impact of crop yield loss due to trace gases is significant all over the world. Ozone injury to plants is evident often as a fine tan to dark colored stippling pattern on the upper leaf surface that accumulates through the growing season. However, the impact of ozone is not always obvious to the naked eye. Aura’s data help scientists monitor the trace gases levels around the world and how they change over time.
Trace gases can have negative effects on crops by impacting pollinators as well. By pollinating many crop and flower species, honeybees and other pollinators are integral to ecosystem health and food resource security. Crops vary on their dependence on pollination, ranging from completely dependent to not at all. About 40 percent of crops rely on insect pollination to some extent. Overall, trace gases likely have contributed to the decline in honeybees, but there are many other factors that may have contributed.
Since human population is projected to grow to 8.5 billion by 2030 (UN), scientists are working to gain important knowledge of how to achieve necessary food resources. Food security initiatives largely focus on issues like water resources, nutrition, and disruptions to food distribution systems.
COVID-19 Impacts
Economic and social shutdowns in response to the COVID-19 pandemic led to noticeable changes in Earth’s environment, at least for the short term. NASA researchers used satellite and ground-based observations to track these impacts on our air, land, and water.