Education and Outreach Materials
Learning with Aura
Printable Resources
The Ozone Layer “Our Global Sunscreen”
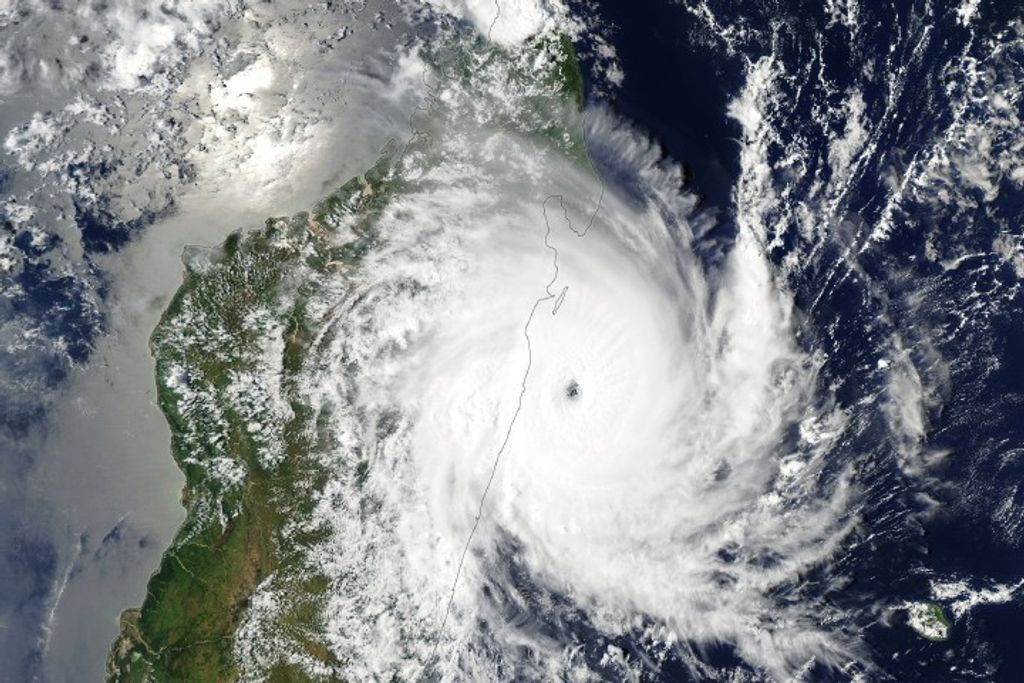
In the Fog about Smog : Solving the Smog Puzzle on Earth and from Space
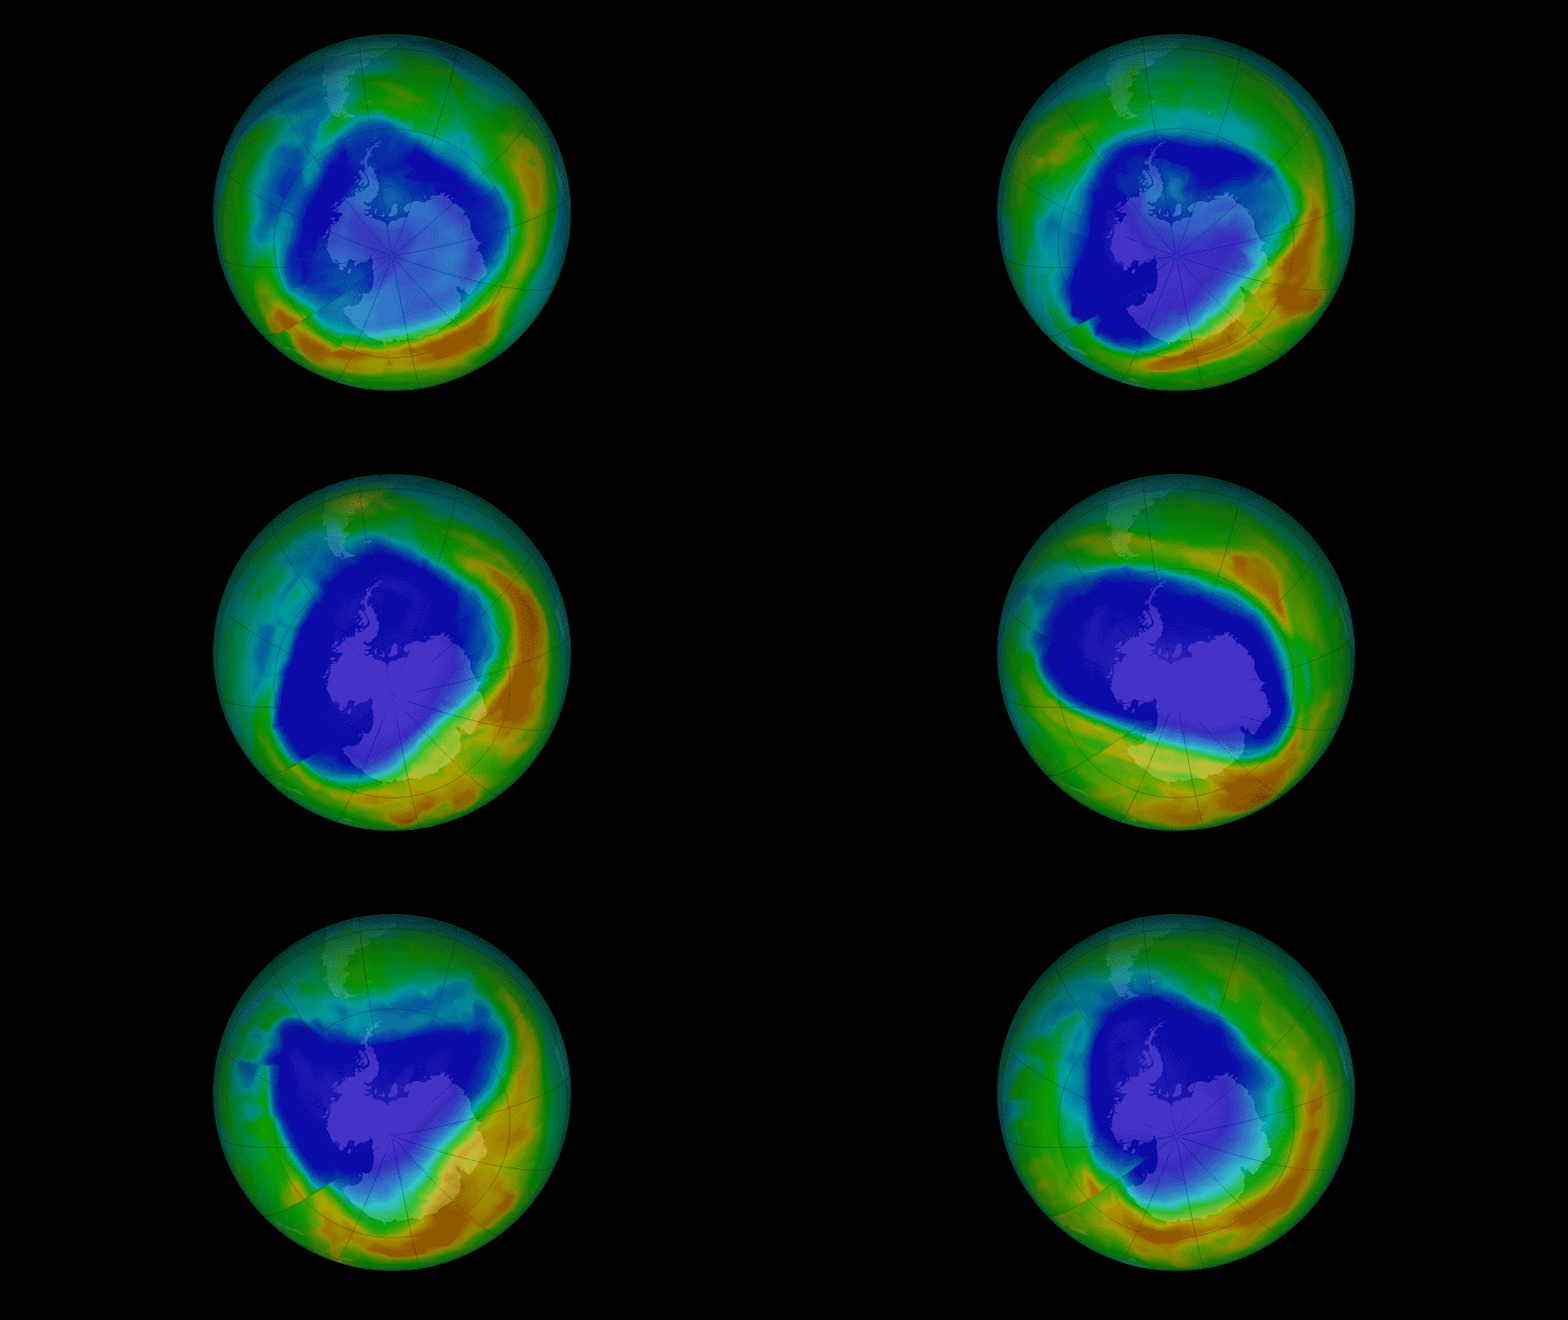
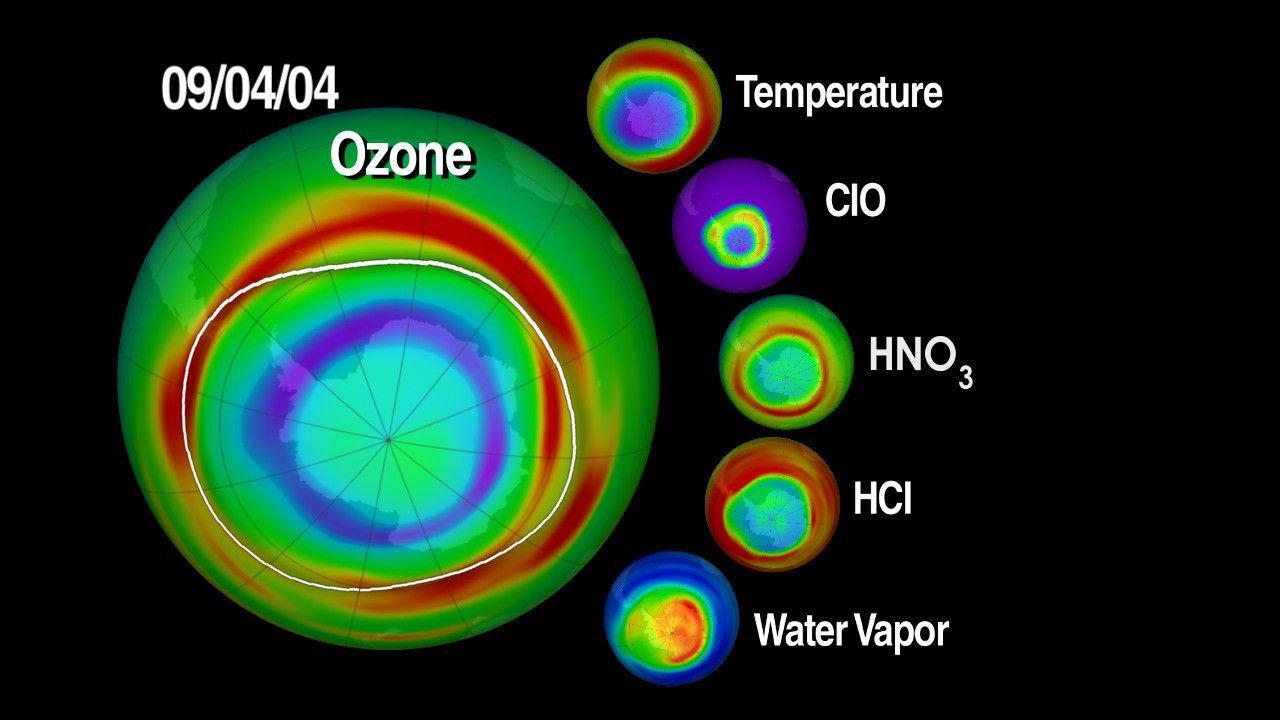
The Ozone Hole - Over 30 years of NASA Observations (poster)
MARVEL's custom edition comic inspired by the 30th anniversary of the Montreal Protocol
ChemMatters Article – Ozone, Out Global Sunscreen
NASA’s Ozone Hole Poster [2MB PDF file]
Educational Activities
Ozone Lessons
These set of lesson plans use real NASA data to help students understand how ozone can be both "good up high and bad nearby." Students will explore how scientists use data to describe the atmosphere. Students will practice graphing skills to analyze human impacts on ozone concentrations on the ground and high in the atmosphere.
Color Mapping Lesson & Ozone Poster
This will introduce students to the use of color maps to visualize data about stratospheric ozone.
Engineer a Satellite
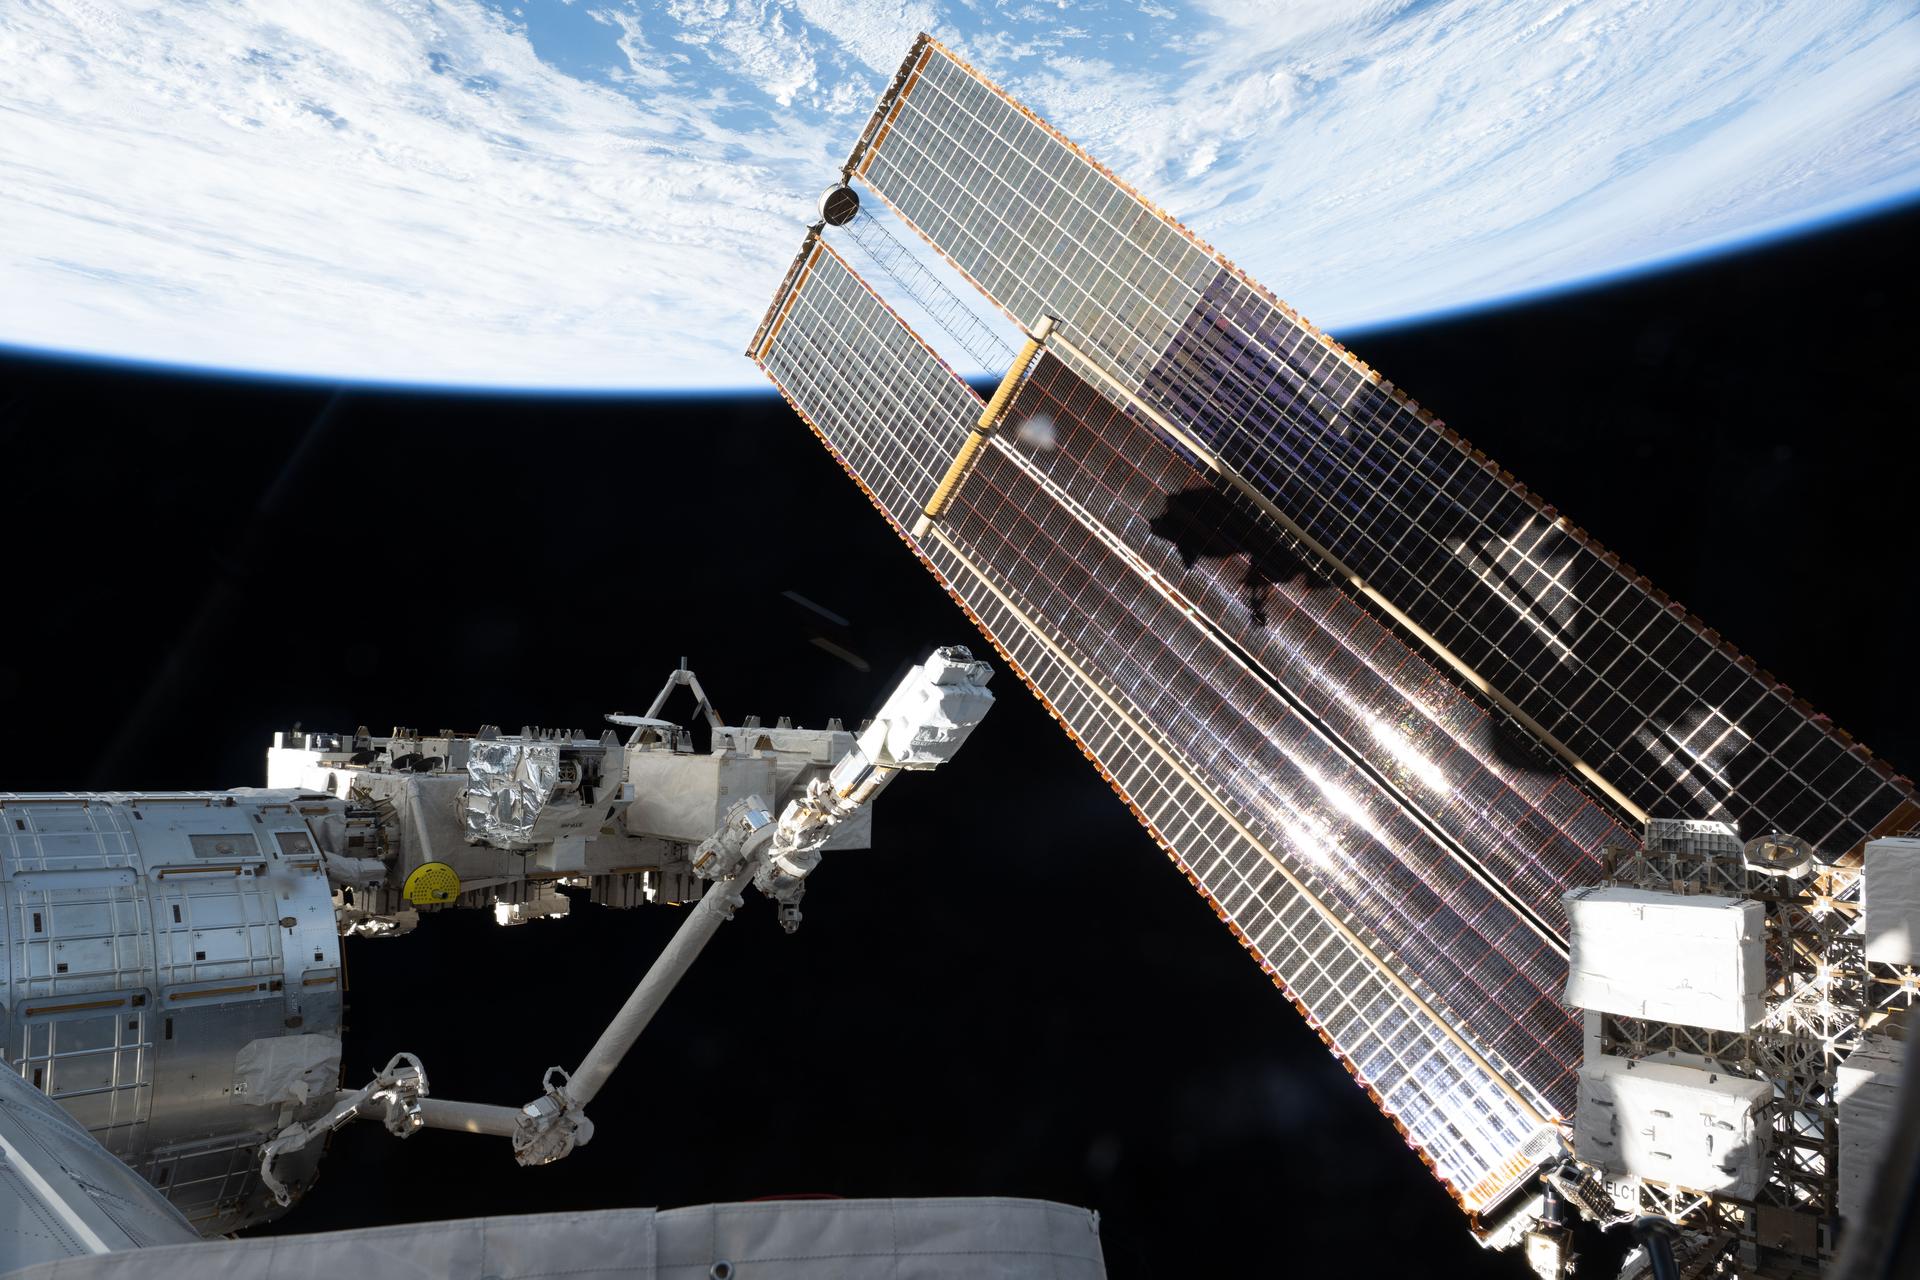
In this activity, you will select the scientific instruments for your satellite, calculate the power requirements for all the subsystems, and construct a scale model of your very own Earth observing satellite.
Sensors, Circuits, and Satellites
Lessons that integrate inquiry with active-learning experiences to engage students in the properties of electromagnetic energy and remote sensing. The investigations are sequenced to help the learner construct their knowledge about the electromagnetic spectrum while offering real world examples from NASA. Created in collaboration with littleBits™ with companion activities available online
- Teacher’s Guide [3.4Mb PDF]
- Lesson 1: Wave Generator [5.9Mb PDF]
- Lesson 2: Energy Meter [3.6Mb PDF]
- Lesson 3: Measuring the Atmosphere [6Mb PDF]
- Lesson 4: Digital Communications [3.4Mb PDF]
ChemMatters
- View All Archives
- Sept 2002 : "Meet the People of Aura"
- Oct 2003 : "Whose Air is it Anyway?"
- Sept 2005 : "Aura Launches!"
Engineer A Satellite
Construct a scale model of your very own Earth observing satellite
The Electromagnetic Spectrum
Introduces electromagnetic waves, their behaviors, and how scientists visualize these data.
“Exploring Ozone in our Atmosphere”
These set of lesson plans use real NASA data to help students understand how ozone can be both "good up high and bad nearby." Students will explore how scientists use data to describe the atmosphere. Students will practice graphing skills to analyze human impacts on ozone concentrations on the ground and high in the atmosphere.
Exploring Color Maps: Visualizing the Ozone Hole
Scientists use colors and other representations for data to help interpret and visualize information. In this activity, students create their own color map and discover that selecting a good color scale is essential to understanding data and to communicating science accurately.
Ozone Hole Watch
Get the latest status of the ozone layer over the South Pole. Satellite instruments monitor the ozone layer, and the data is used to create images that depict the ozone.
Learn More