


Why Aura?
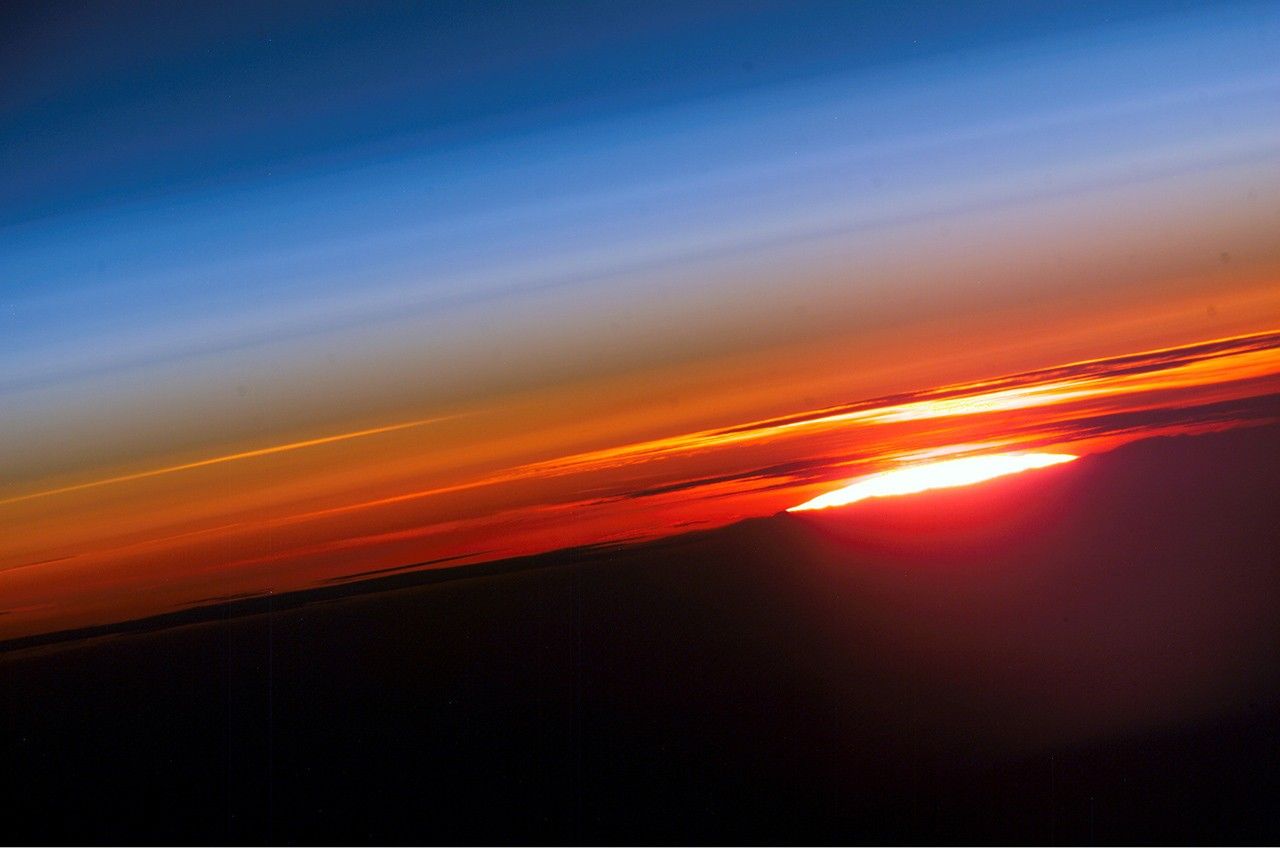
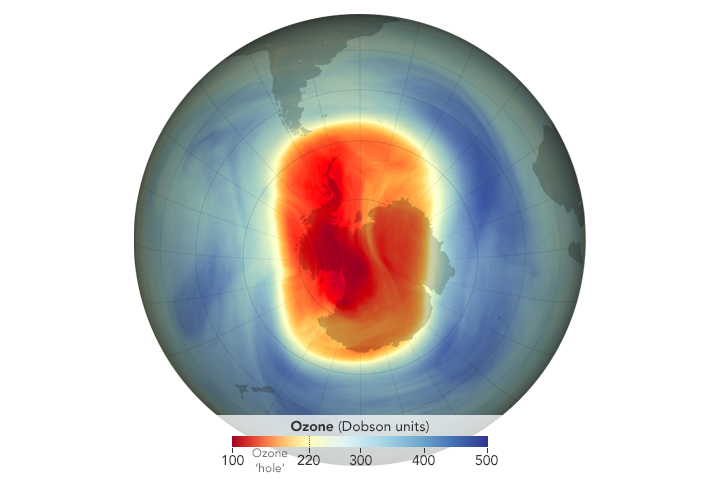
Earth's ozone shield protects all life.
Stratospheric ozone has decreased 3% globally between 1980 and 2000 and thins by 50% over Antarctica in winter and spring. Depletion of the ozone layer allows more ultraviolet radiation to reach the surface. Increases in UV radiation is known to have harmful effects on living things. The Montreal Protocol and its amendments have banned the use of ozone destroying chemicals and the rate of ozone depletion seems to have slowed.
Earth's tropospheric composition is fundamental to public health and ecosystems.
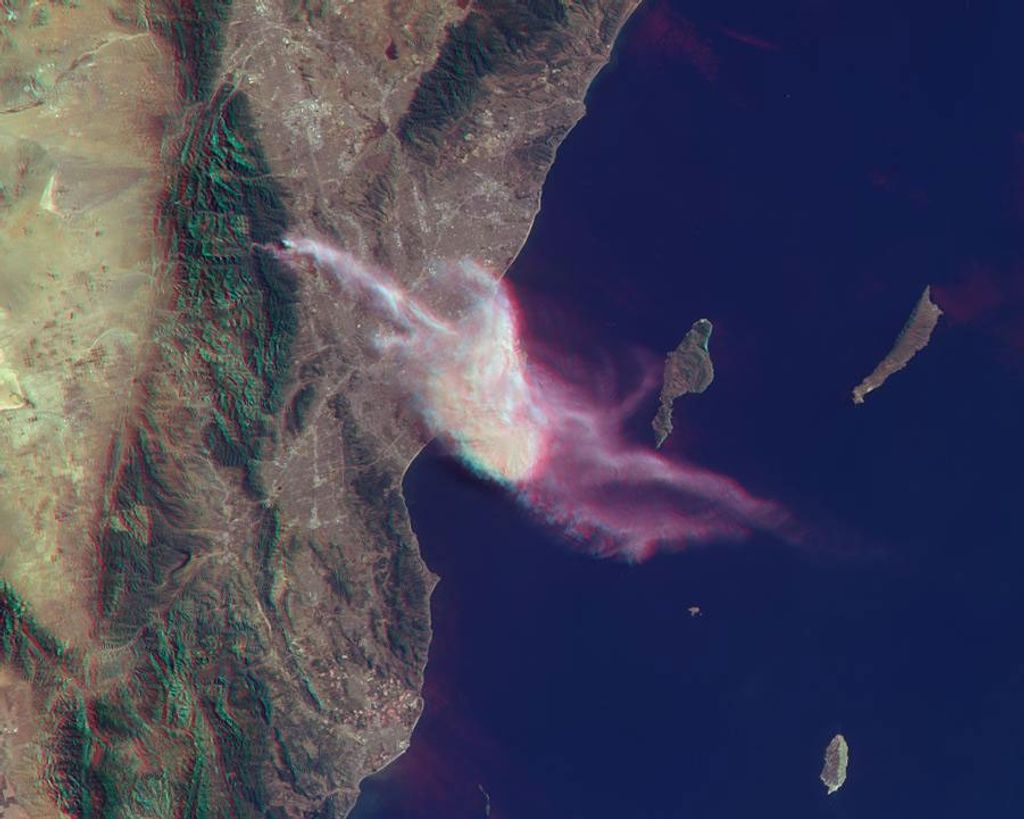
The atmosphere has no political boundaries; tropospheric constituents moves great distances across oceans and continents. The quality of air has degraded over certain parts of the world and has become a health issue.
Aura is designed to answer questions about changes in our life-sustaining atmosphere.
Aura's four instruments study the atmosphere's chemistry and dynamics. Aura's measurements will enable us to investigate questions about ozone trends and air quality changes.
Aura's measurements will provide accurate data for predictive models and provide useful information for local and national agency decision support systems.
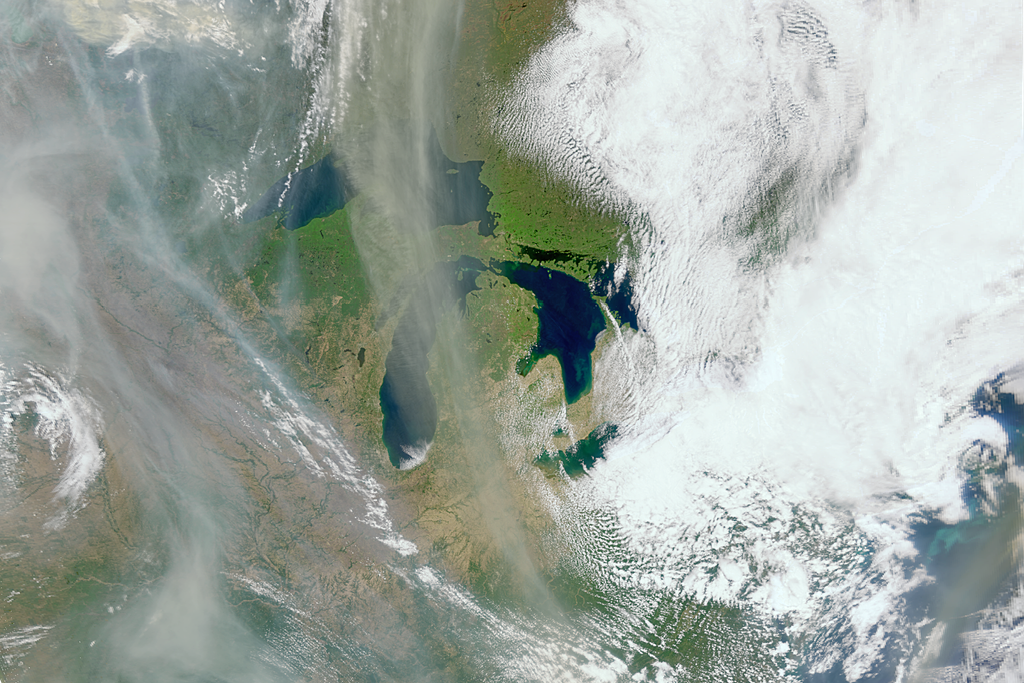
Monitoring tropospheric composition
Instruments on NASA satellites, along with airborne and ground-based sensors, are constantly collecting data on trace gases in our atmosphere.
Learn More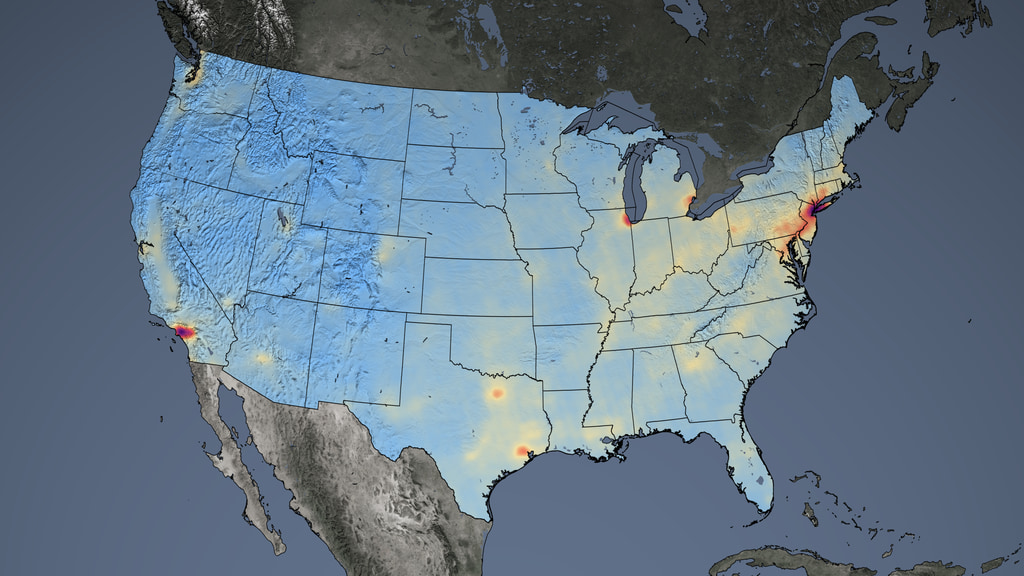
Learn More
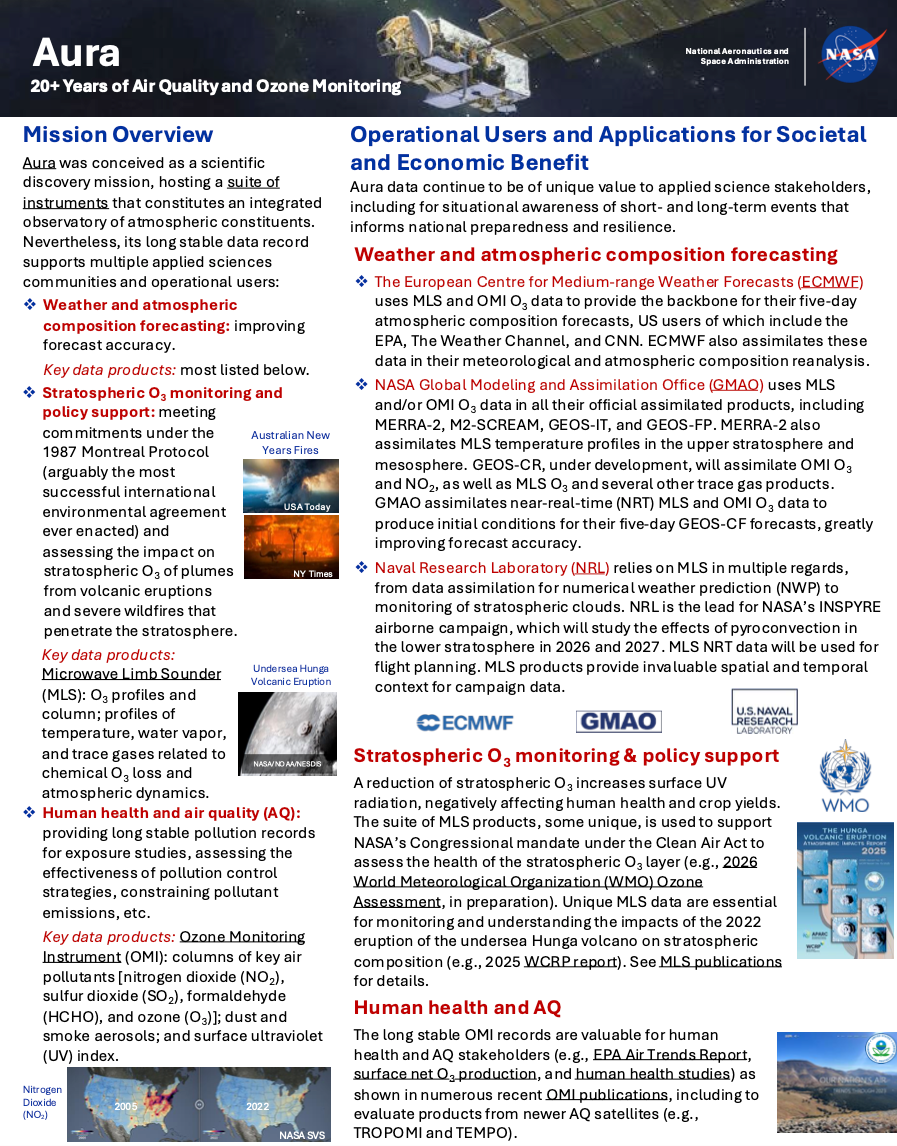
Aura Mission Overview
Operational Users and Applications for Societal and Economic Benefit
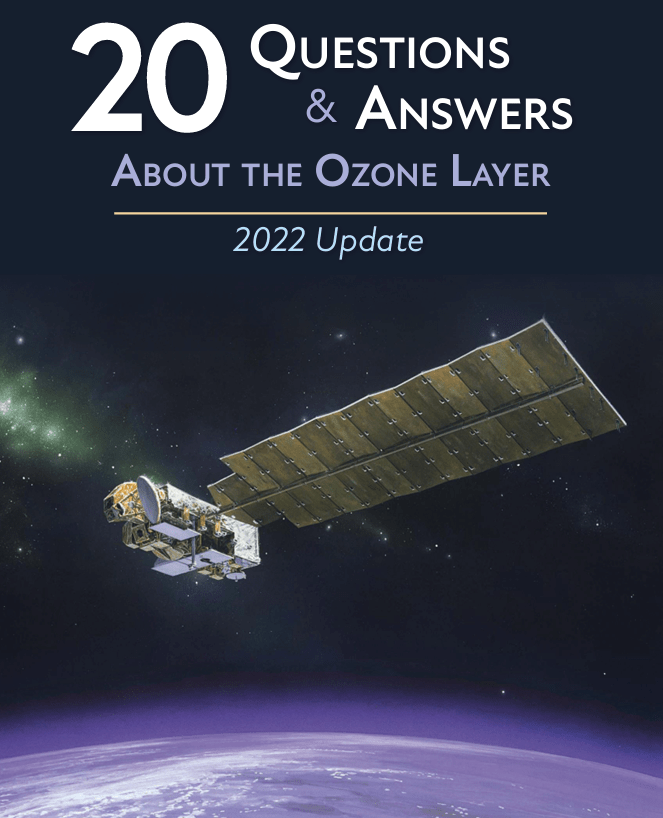
20 Questions and Answers About the Ozone Layer
This is a component of the Scientific Assessment of Ozone Depletion. (2022)
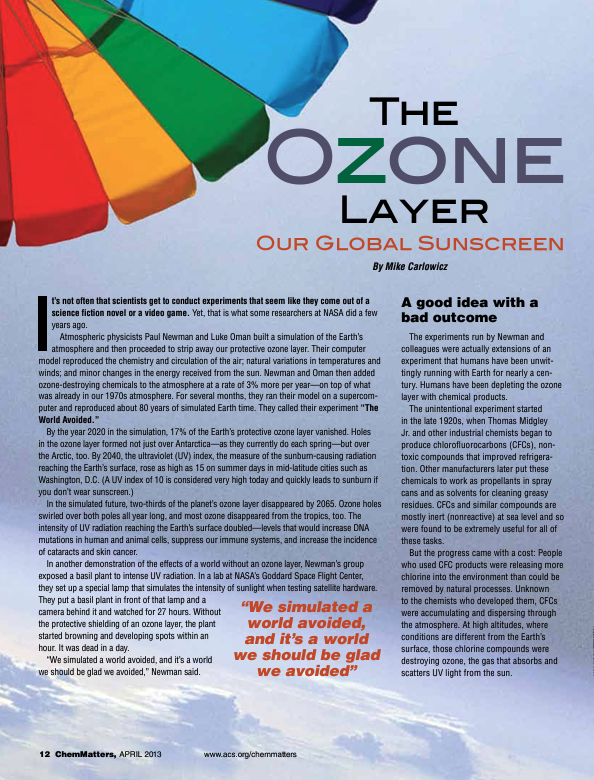
The Ozone Layer : Our Global Sunscreen
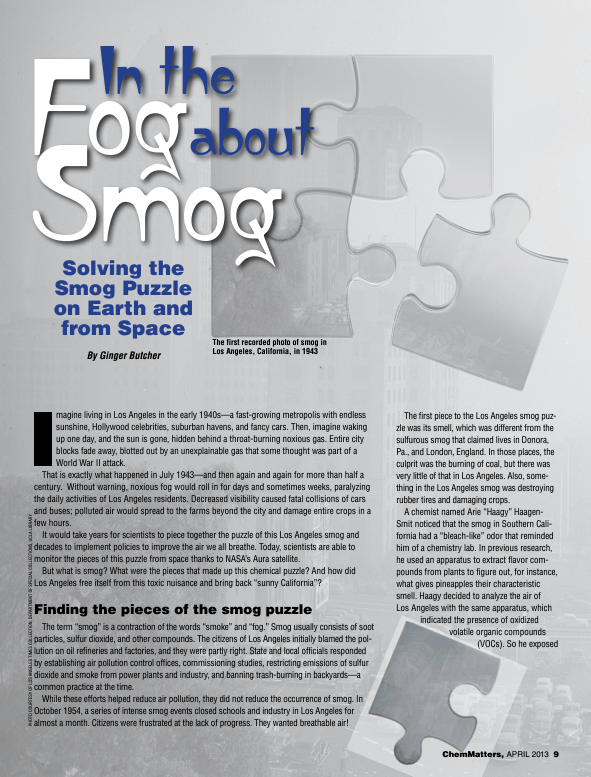
Informational article about the Ozone from ChemMatters 2013
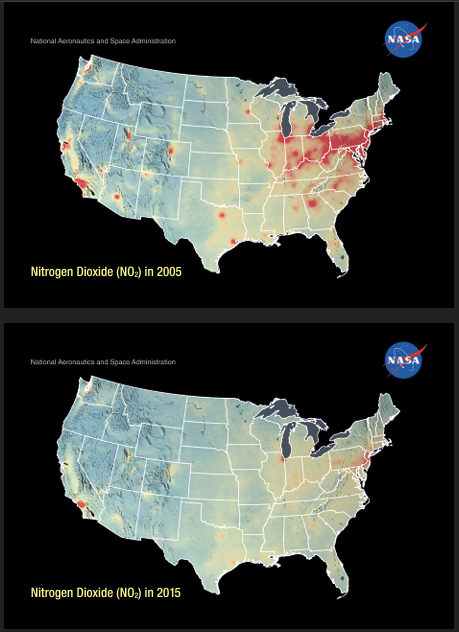
US Air Pollution
Compare global air pollution in the US with Nitrogen Dioxide in this lenticular.