


Technical Graphs and Data Gallery

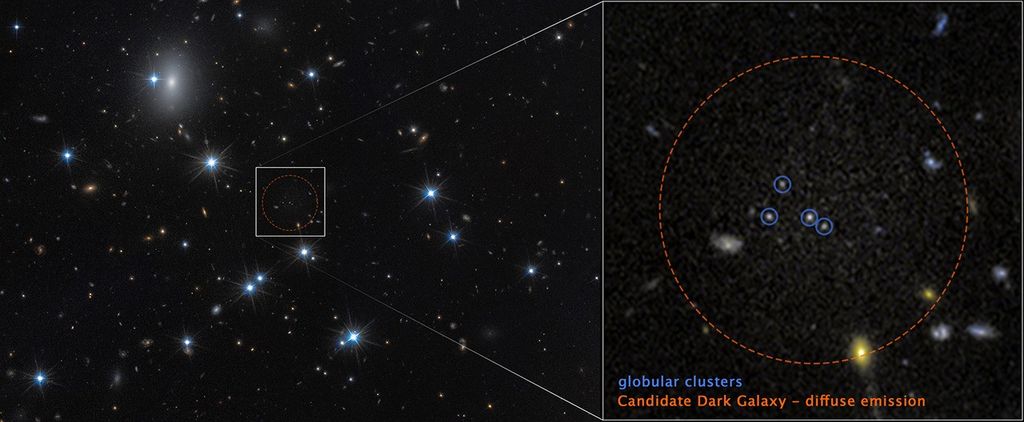
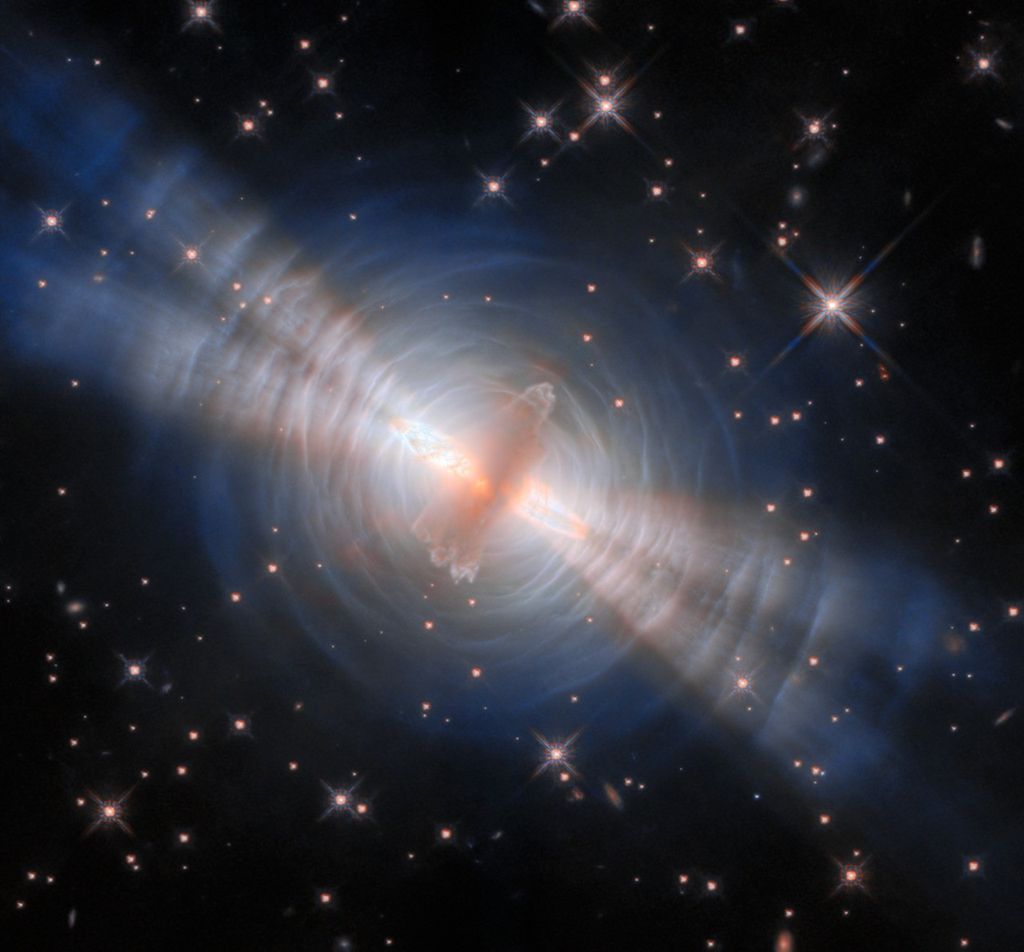
A candidate for a galaxy
A candidate for a galaxy at z≈9.6, magnified by a factor of ~15 by the foreground cluster MACSJ1149+2223 (z ≈ 0.54). The object was found in an HST survey using the WFC3IR camera (Zheng et al. 2012). This young object is seen when the universe is only about 500 million years old.

Microlensing search area
The area around another star that the Roman Space Telescope will search (in blue) for exoplanets compared to Kepler's search area.

Roman's Forward Optical Assembly
The main pieces of Roman's Forward Optical Assembly.
Credit: NASA


Coronagraph sensitivity
The Roman Coronagraph sensitivity to detecting planets as a function of planet-to-star flux ratio and separation from the parent star. The Roman Coronagraph provides a 100 to 1000 times improvement over existing and planned facilities. [The source code and input data for this plot are maintained here.] Credit: NASA
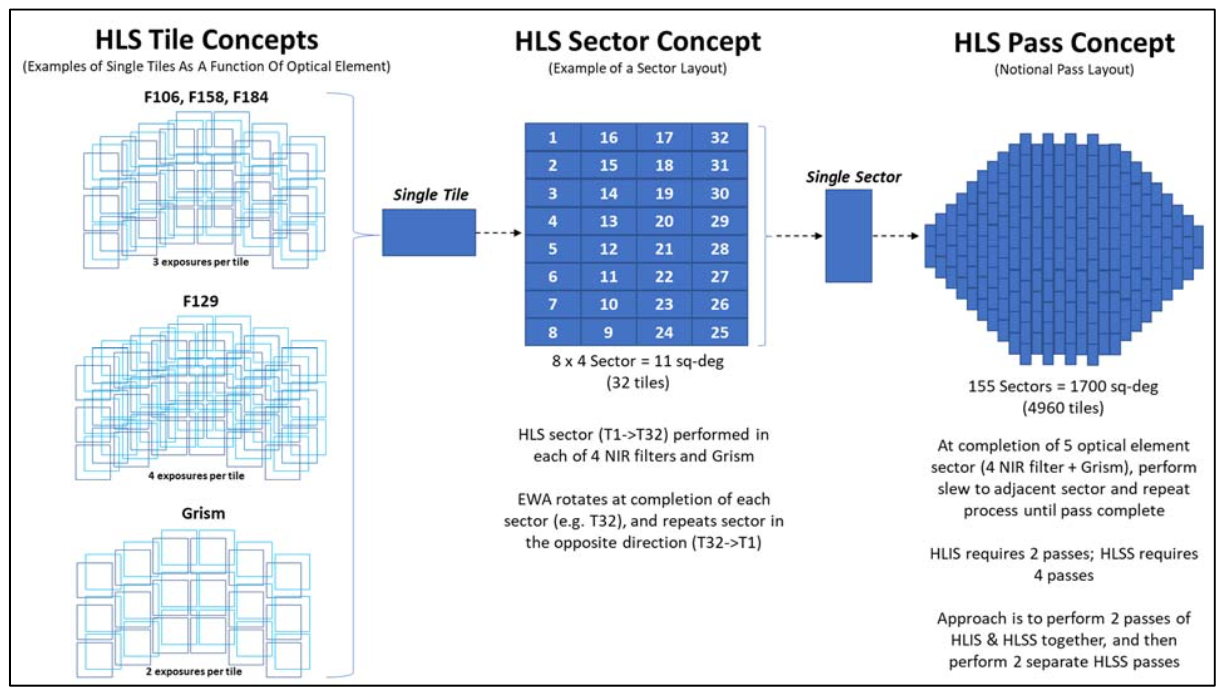
High-Latitude Spectroscopic Survey figure


Layout of a nominal supernova survey region.
ach sector in this concept consists of 16 tiles, arranged in three columns of (5,6,5) tiles per column. The resulting sector footprint, when rotated through 12 orients spaced at 30 degree intervals throughout the year, fully covers a 5 deg2 area (red circle) and partially covers an additional 3 deg2 area (annulus between red and blue circles). [Credit: Dan Scolnic, Charles Baltay].
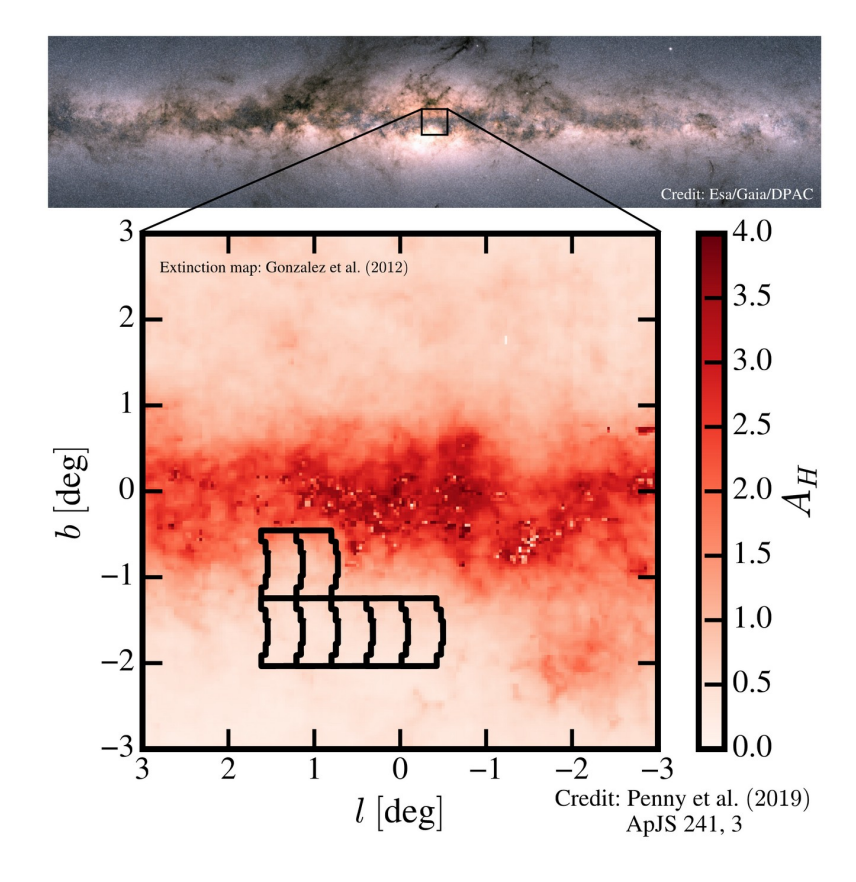
Notional placement of the Galactic Bulge Time Domain Survey fields
The upper image shows the inner half of our Milky Way galaxy in false color, with the Galactic Bulge at the center. Dark patches are regions where the background starlight is obscured by interstellar dust. The lower image is a 6x6 degree region near the Galactic center, where the color-bar indicates the amount of dust extinction. The locations of seven Galactic Bulge Time Domain Survey WFI fields shown in the inset optimizes a combination of high stellar density and comparatively low dust extinction, to maximize the yield of microlensing events.
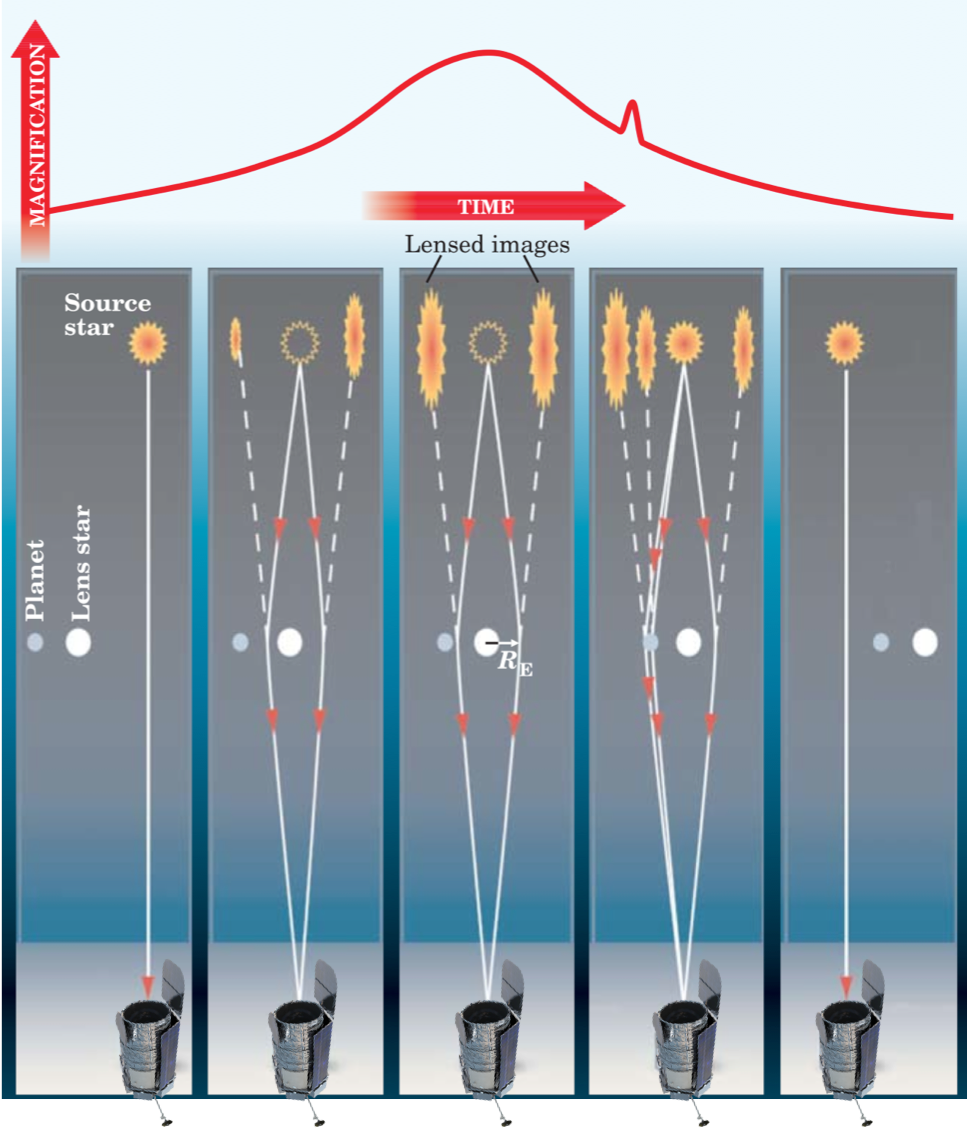
Roman microlensing technique
Roman will search for exoplanets using the microlensing technique displayed above. As a lens star moves across the line of sight of the telescope, an exoplanet will magnify a background star's signal.
Credit: NASA

Microlensing Events
Schematic illustration of how the Roman Space Telescope discovers signals caused by planetary companions in primary microlensing events, and how planet parameters can be extracted from these signals. The left panel shows a simulated primary microlensing event, containing a planetary deviation from an Earth-mass companion to the primary lens. The offset of the deviation from the peak of the primary event, when combined with the primary event parameters, is related to the projected separation of the planet. The right panel shows an enlargement of the planetary perturbation. The width and precise shape of the planetary deviation yield the mass of the companion relative to that of the primary host lens.