


SWOT Stories
Explore how rivers move, change, and sustain life across the planet with SWOT data.
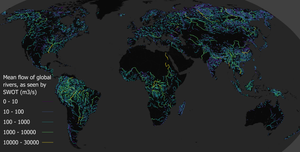
In a first, a space mission led by NASA and France has tracked Earth’s rivers swelling and shrinking from month to month over the course of a year and found significantly less of a swing than previous model-based estimates. A…

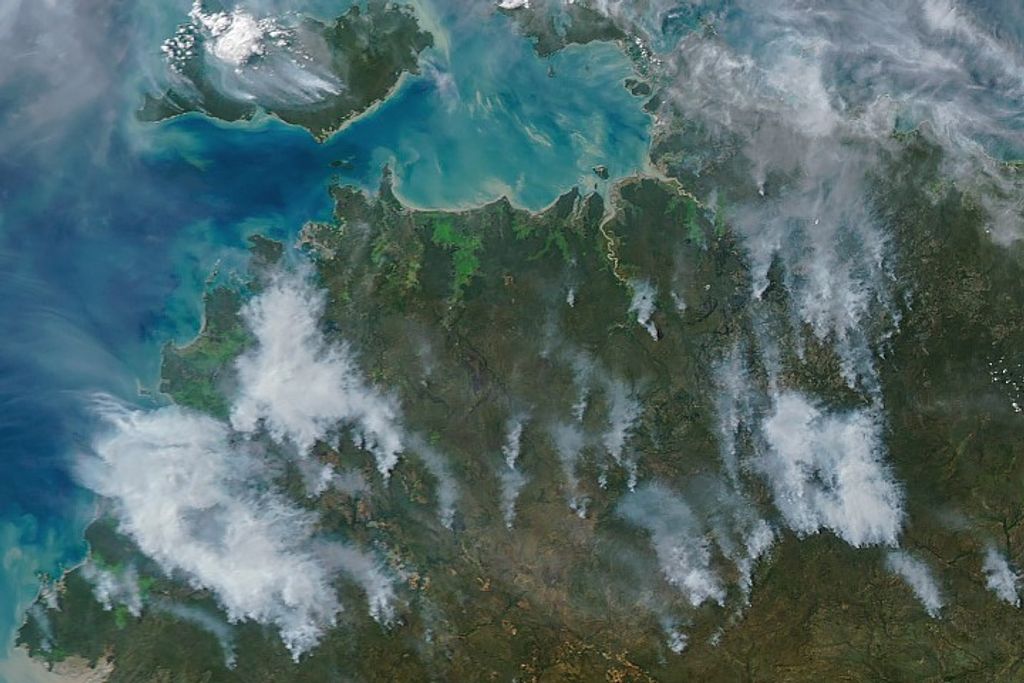
A mild La Niña caused greater rainfall over the Amazon basin, which offset rising sea levels due to record warming of Earth’s oceans. The rise in the global mean sea level slowed in 2025 relative to the year before, an…

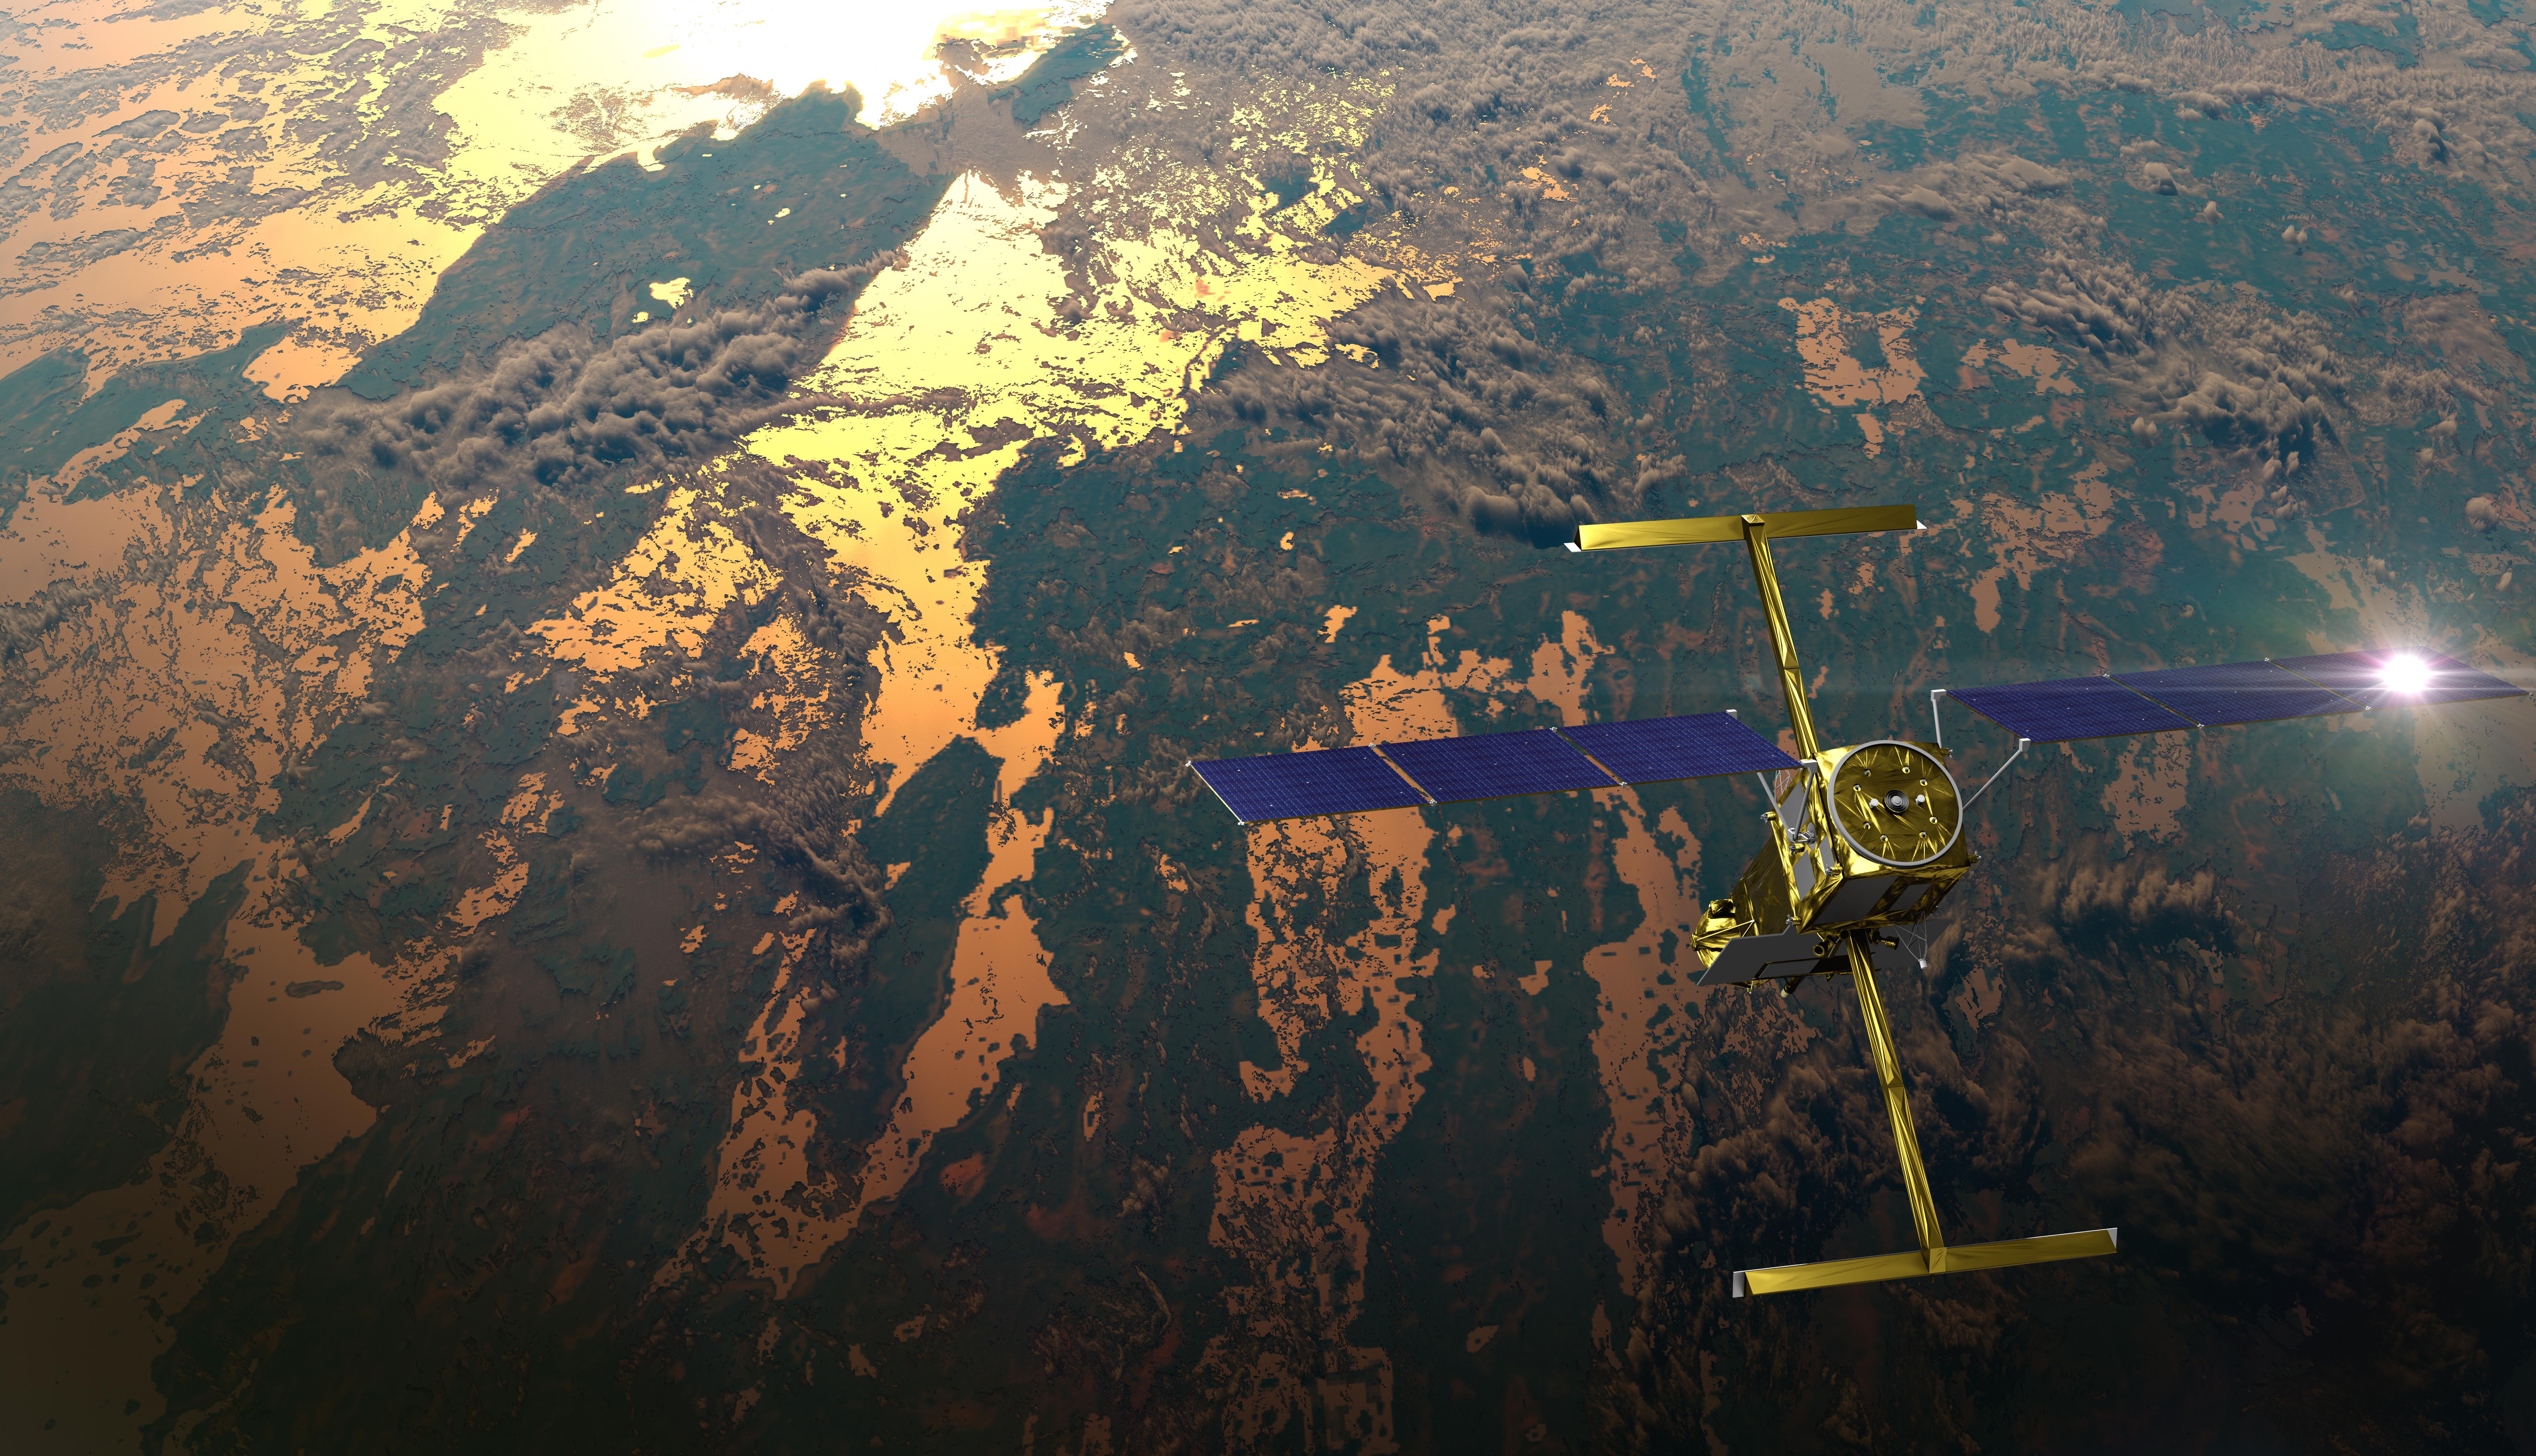
The SWOT satellite caught the leading edge of the tsunami wave that rolled through the Pacific Ocean on July 30, 2025.
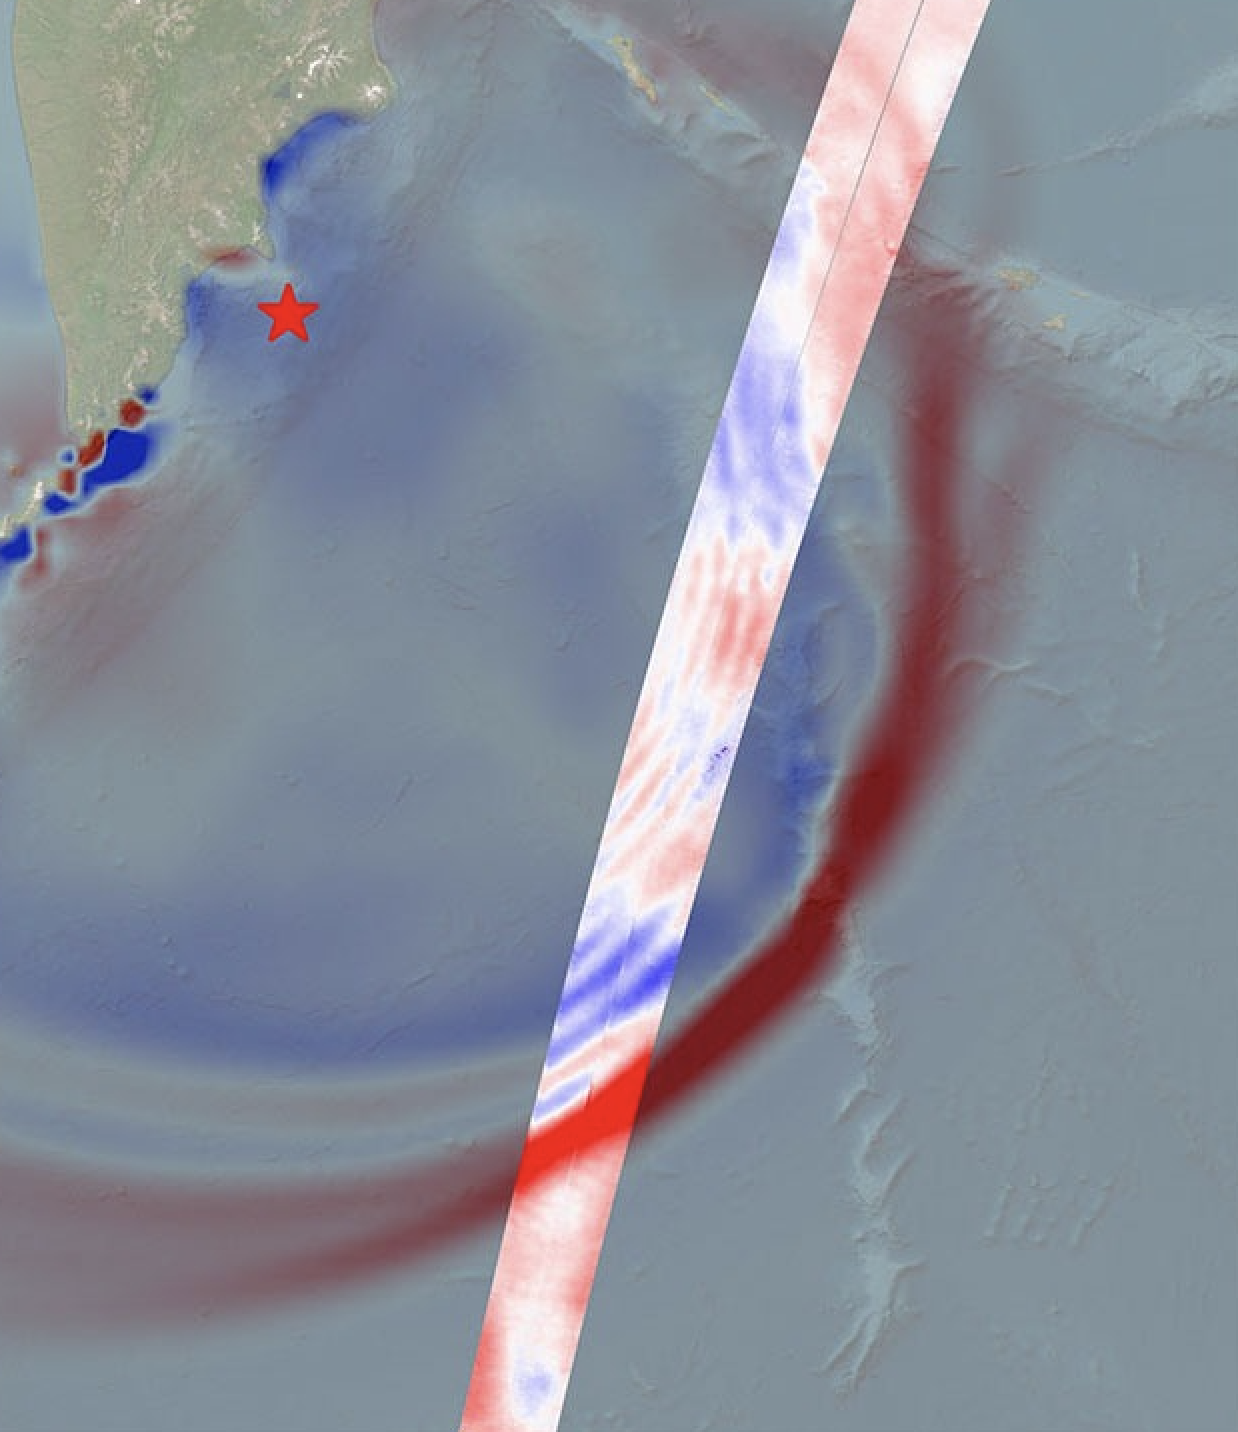
Data provided by the water satellite, a joint effort between NASA and the French space agency, is helping to improve tsunami forecast models, benefitting coastal communities. The SWOT (Surface Water and Ocean Topography) satellite captured the tsunami spawned by an…

In a first, researchers from NASA and Virginia Tech used satellite data to measure the height and speed of potentially hazardous flood waves traveling down U.S. rivers. The three waves they tracked were likely caused by extreme rainfall and by…

The international mission collects two-dimensional views of smaller waves and currents that are bringing into focus the ocean’s role in supporting life on Earth. Small things matter, at least when it comes to ocean features like waves and eddies. A…
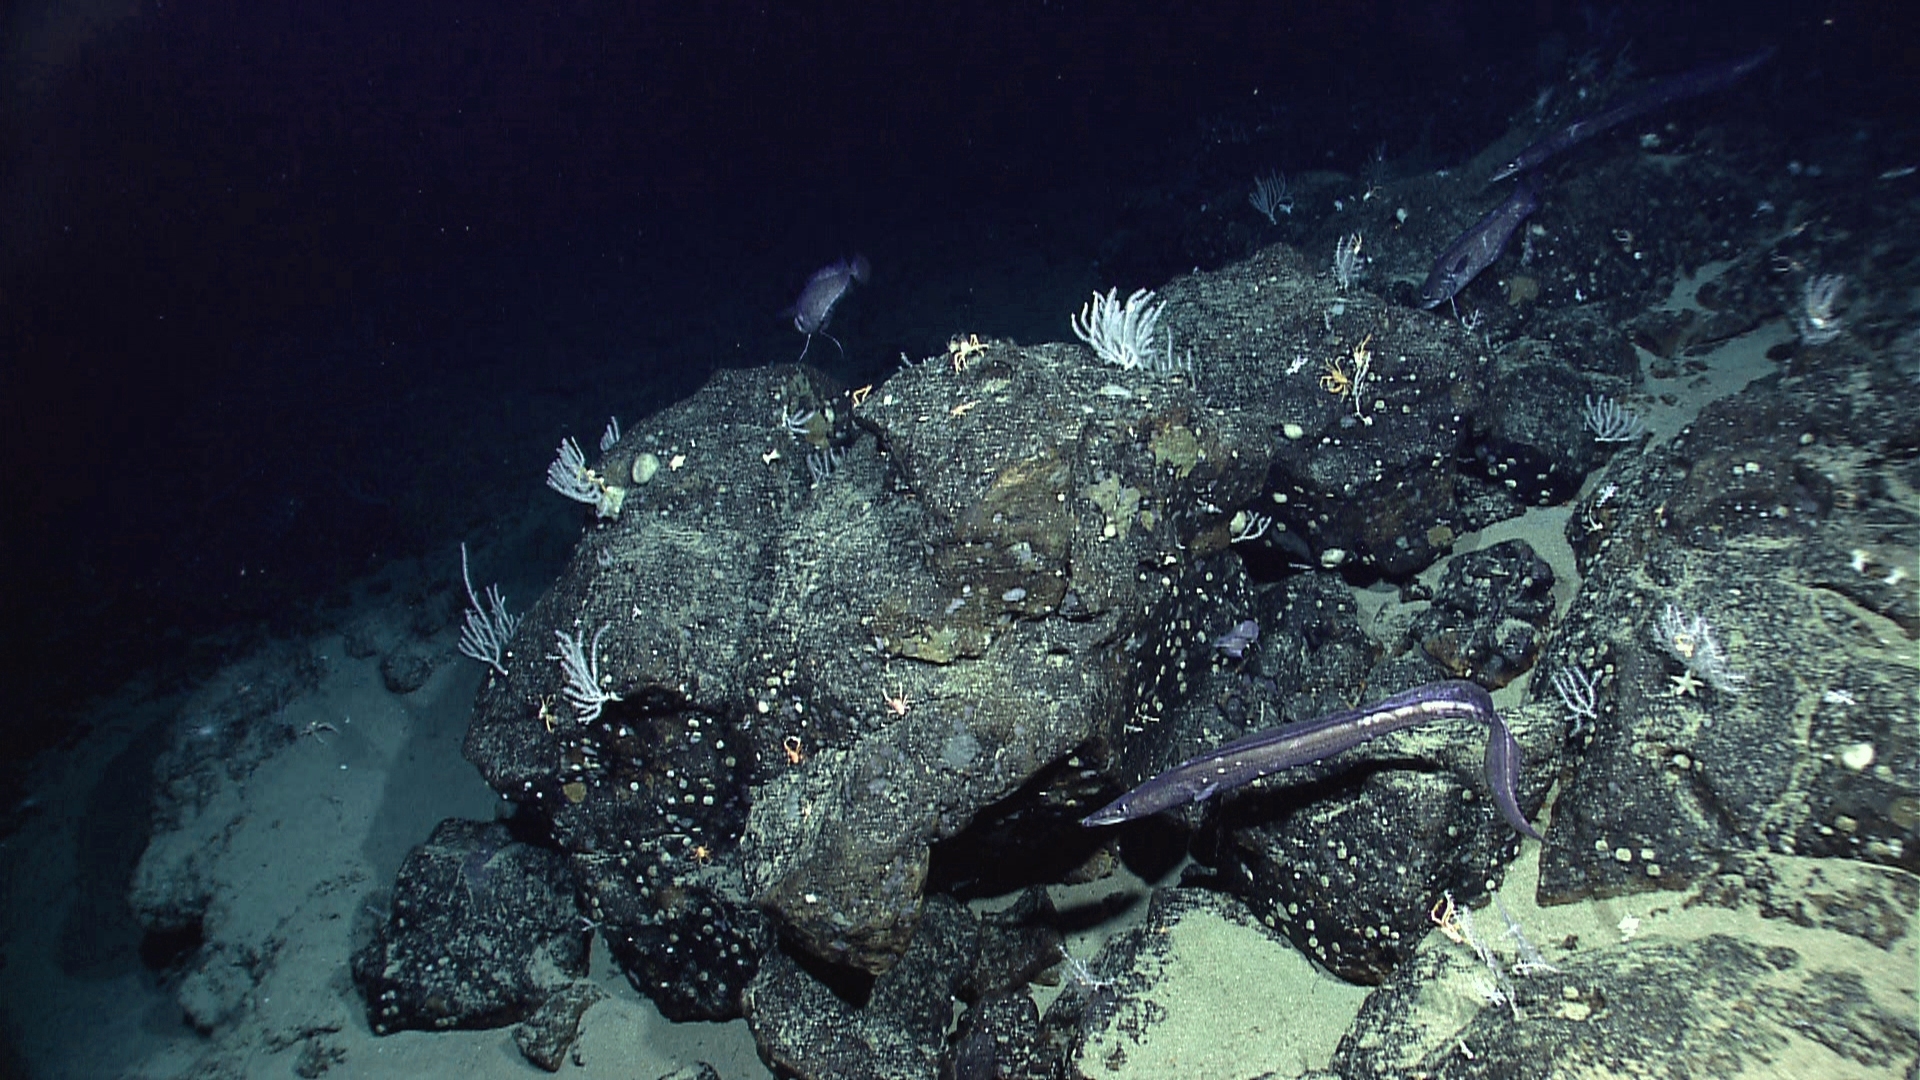
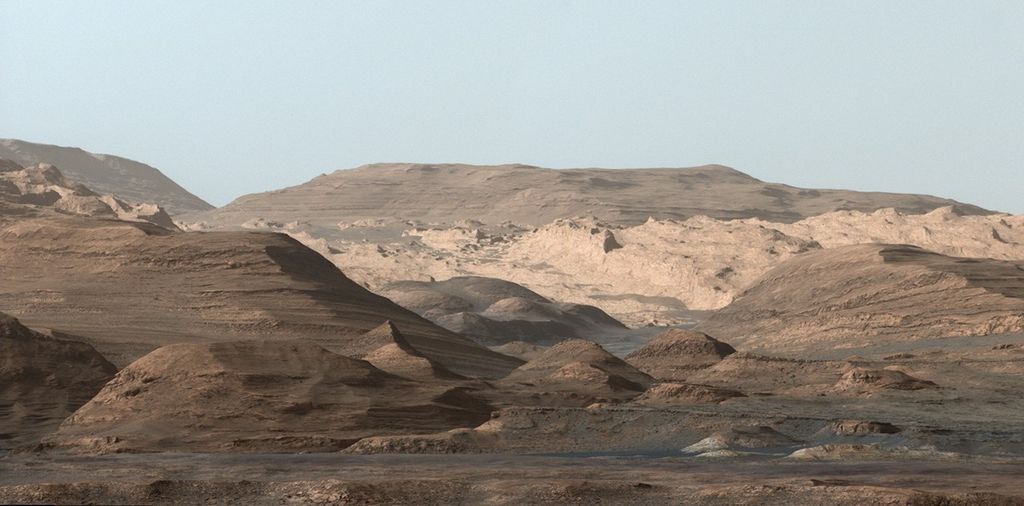
More accurate maps based on data from the SWOT mission can improve underwater navigation and result in greater knowledge of how heat and life move around the world’s ocean. There are better maps of the Moon’s surface than of the…
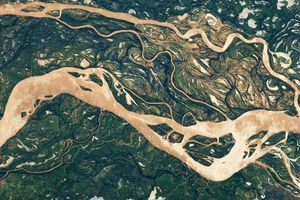
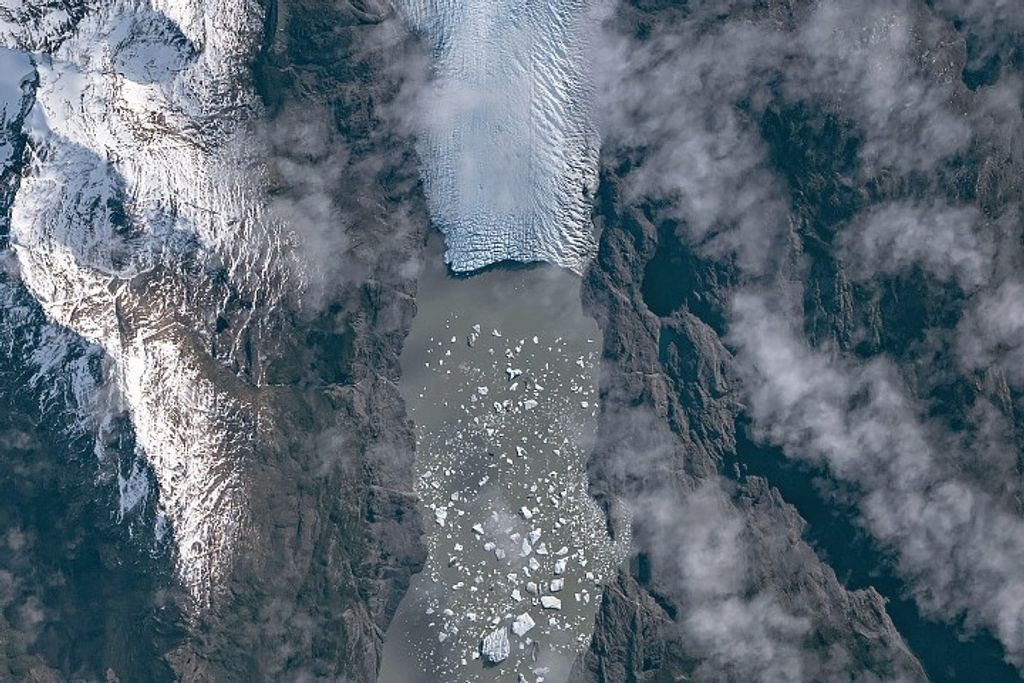
Rivers and streams wrap around Earth in complex networks millions of miles long, driving trade, nurturing ecosystems, and stocking critical reserves of freshwater. But the hydrologists who dedicate their professional lives to studying this immense web of waterways do so…
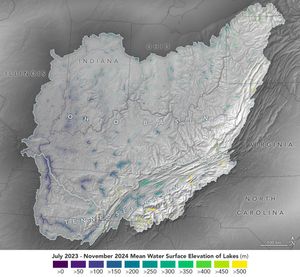
Data from the SWOT satellite was used to calculate average water levels for lakes and reservoirs in the Ohio River Basin from July 2023 to November 2024.