


By Earth Resources Observation and Science (EROS) Center
Hurricanes aim at Florida’s long coastline more than any other state. From 1980-2024, Florida experienced 30 hurricanes that each caused more than $1 billion in losses, according to the National Oceanic and Atmospheric Administration (NOAA).
Insurance companies use computer models that project hurricane losses to more accurately estimate their annual losses and calculate their rates. The Florida Commission on Hurricane Loss Projection Methodology is an independent panel of experts tasked by the Florida Legislature to evaluate loss models for hurricanes and subsequent flooding. The panel sets standards for the models used in Florida to make sure insurance companies charge rates that are adequate to cover losses but that are not excessive.
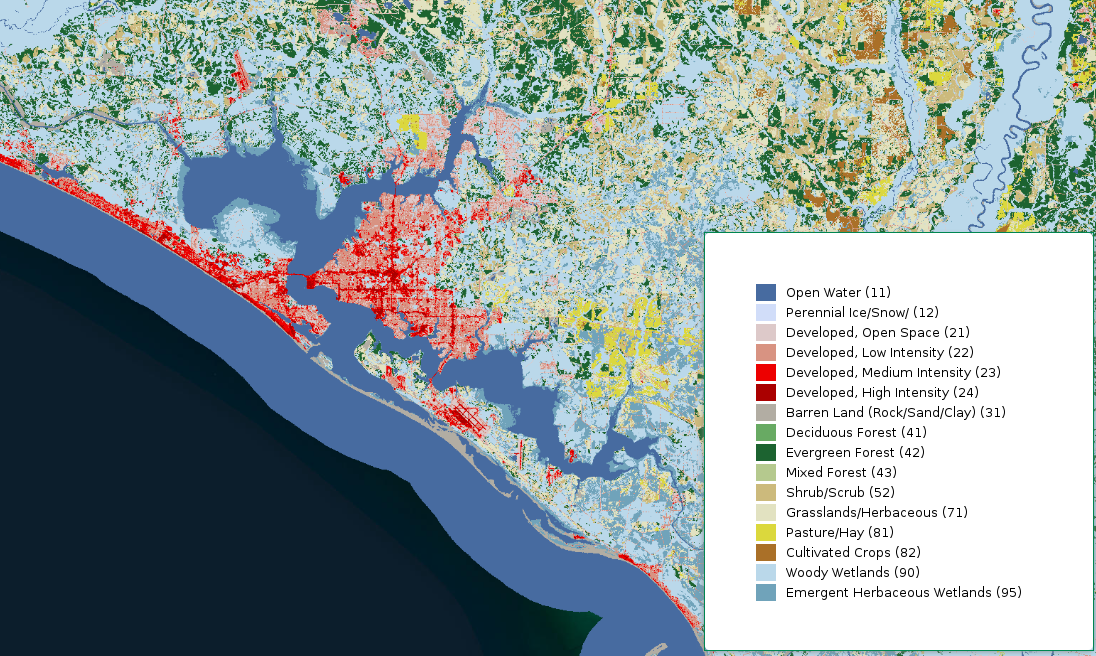
Many uses for Landsat data have been developed since the Earth observation satellite program started capturing imagery 53 years ago. One example is the National Land Cover Database (NLCD), the definitive land cover mapping product for the United States produced by the U.S. Geological Survey. The Florida Commission on Hurricane Loss Projection Methodology’s hurricane standards specify that modelers are expected to use a recent version of NLCD or a land use and land cover database that’s consistent with NLCD.
How Does Land Cover Data Help Model Hurricane Loss?
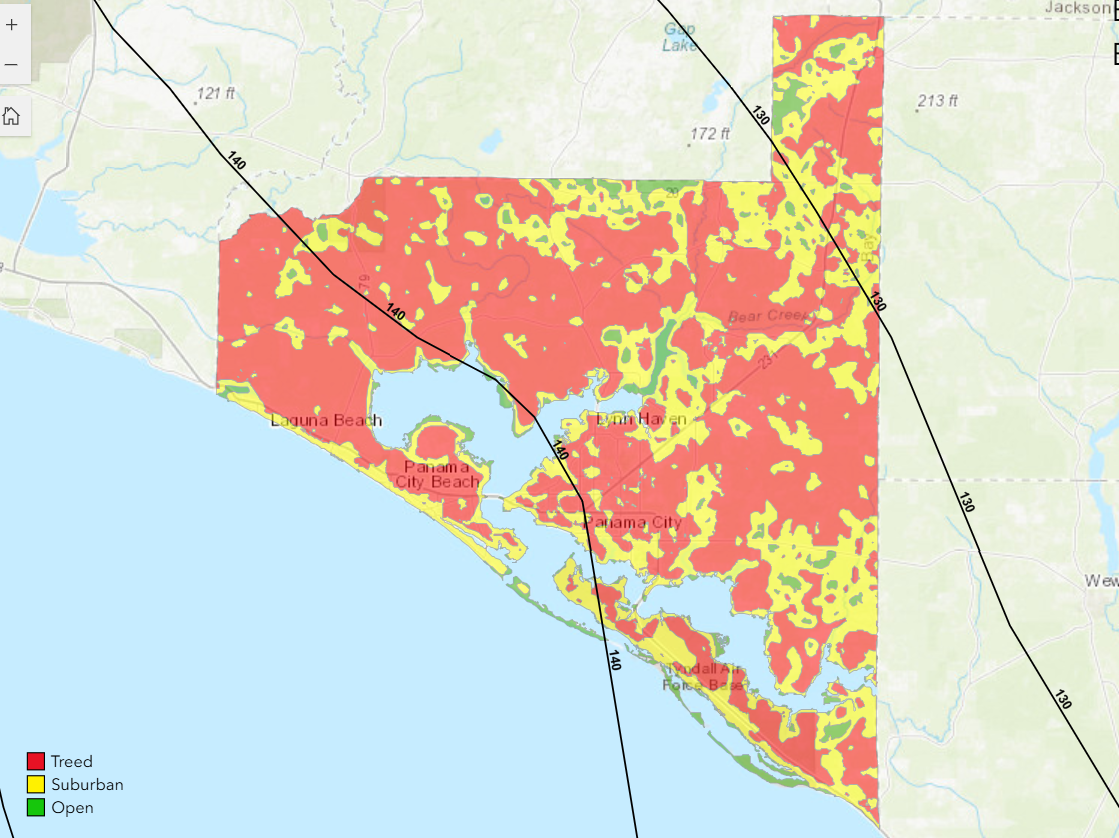
What covers the land can vary from forests and buildings to grassland and open water. In hurricane modeling, land cover translates to surface roughness, with some cover types being smoother than others. The surface roughness can affect wind flow in dramatically different ways.
“In the wind engineering world, the more stuff that’s getting in the way, that impacts the wind load (force) that a building—your house, for example—will experience. So it can be a benefit to you if you have a little bit rougher terrain around you than if you’ve just got open fields all over,” said David Mizzen, a senior engineer with Applied Research Associates Inc. (ARA), which contributes to hurricane catastrophe modeling research and applications.
Mizzen works with NLCD data on surface roughness modeling and also uses the NLCD Tree Canopy Cover data layer to supplement the land cover data layer when modeling surface roughness in lightly and moderately developed areas. The Florida Commission on Hurricane Loss Projection Methodology approves of the use of various modeling tools, including those developed by ARA.
NLCD data “gives us a more accurate picture of what the risk is there. If you didn’t have any of that data, and you had to assume that it’s all open terrain or all suburban, you’re not going to be getting that right. And that’s going to play a big role in what your actual risk is,” Mizzen said.
“If we know where a building is, we can give you a pretty good estimate of what the roughness is and how that impacts the wind loads that building is experiencing, which contributes to how it’s going to perform in a windstorm.”
NLCD Data Helps with Building Codes Project
NLCD data was also used extensively to identify inland lakes and make surface roughness determinations in a project related to building codes in Florida. ARA and the University of Florida worked together to provide the Florida Building Commission with a recommendation about an updated definition for Windborne Debris Region designations.
The science-based risk evaluation determined which areas along the coast and inland near large water bodies would best benefit from the use of costlier impact-resistant windows in new buildings vulnerable to windborne debris.
According to Mizzen, NLCD data supports wind and hurricane modeling efforts across the eastern United States, including Puerto Rico and the U.S. Virgin Islands. He said that while the dataset is extensive, it is relatively straightforward to process and adaptable to a variety of modeling needs.
Mizzen noted that the resolution of NLCD data aligns with Landsat’s 30-meter resolution, making it suitable for regional-scale projects like hurricane modeling, forest and rangeland monitoring, and much more.
While people can’t prevent natural disasters like hurricanes from striking, thanks to creative uses of Landsat data and the USGS’s NLCD data, Americans can be better prepared when disasters do hit.